
Do you toss and turn at night worrying about your U.S. Small Business Administration (SBA) loan portfolio? Despite your desire to grow your loan portfolio, booking a loan with a qualification that “the credit is not otherwise available on reasonable terms” can give you heartburn.
Hoping to assuage your concerns, we analyzed the data published by the SBA on the 660,221 7(a) loans originated between October 1, 2009 and March 31, 2022. In combination with the results, we will provide insights to consider on new originations to help calm your restless mind.
Over the last 12 years, the percentage of total charge offs compared to gross approved dollars was 1.5%. As a percentage of all originations, the number of loans that resulted in a charge off was 3.9%. We sought to identify correlations between charge offs and variables such as location, calendar year, and NAICS description.
Prior to the recently identified bear market, the economy experienced its longest expansion period on record. As one would expect given the economic landscape, results were generally positive and consistent year over year.
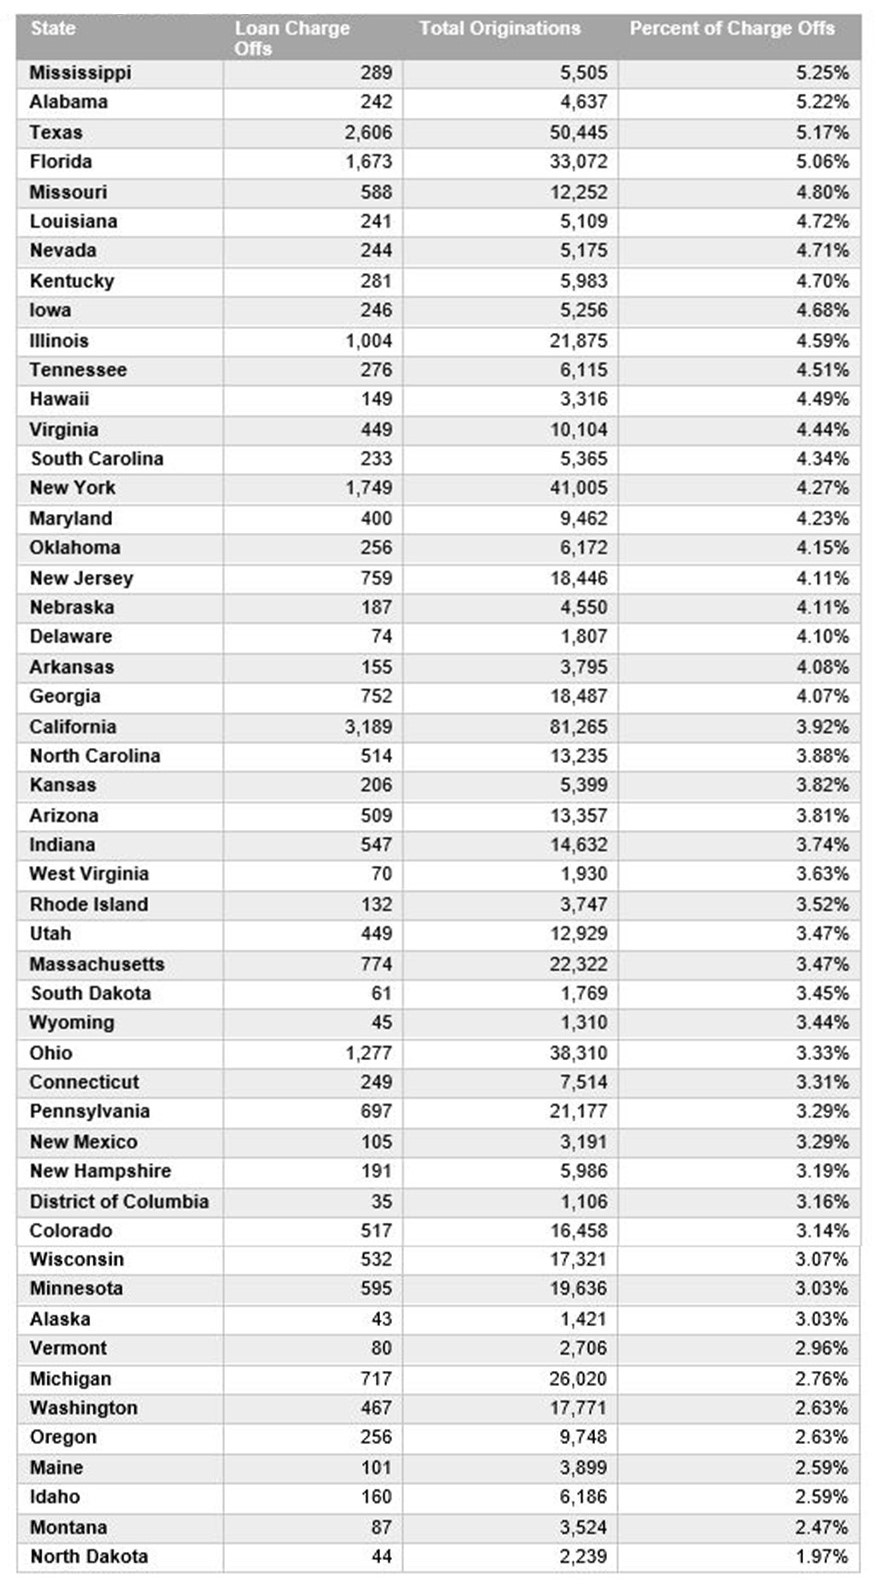
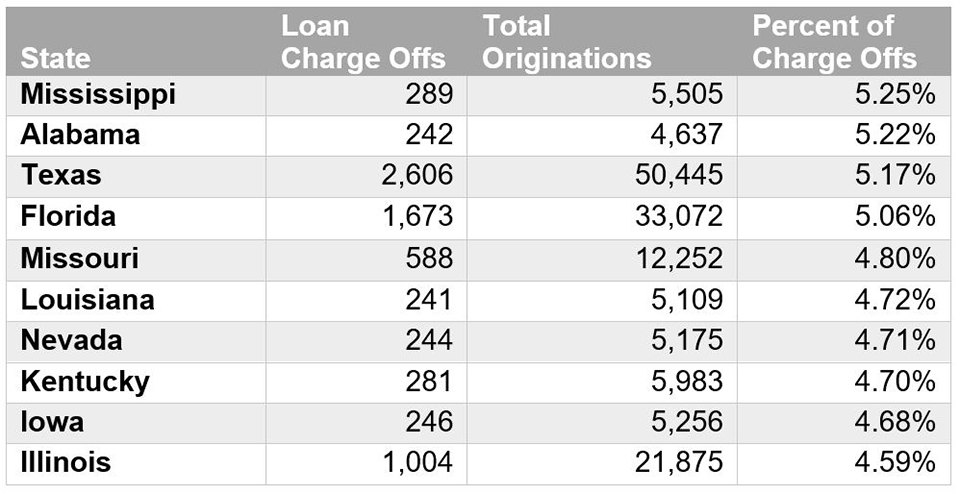
With respect to location, we analyzed the states with the highest concentration of charged-off loans as a percentage of total originations. Mississippi, Alabama, Texas, and Florida were the only four states to exceed 5%. Below is a list of the 10 states with the highest concentration of charged-off loans. As you will see, the entire Gulf Coast region is included on the list. The list of all 50 states and the District of Columbia can be found in the attached appendix at the end of this article.
The second variable tested was year of origination. The average length between origination and charge off was 49 months or just over four years. The year with the highest percent of charge offs compared to originations was 2010. As the decade continued, the percent of charge offs decreased and became more consistent with the average across the sample. Given the proximity to the Great Recession, it appears lingering effects negatively impacted the 2010 originations. As expected, the loans originated between 2019 and Q1 2022 have had a much lower charge-off percentage due to the recency of their issuance and payment relief offered due to COVID. Due to the rising rate environment and lack of continued government assistance, we anticipate the number of charged-off loans to increase going forward.
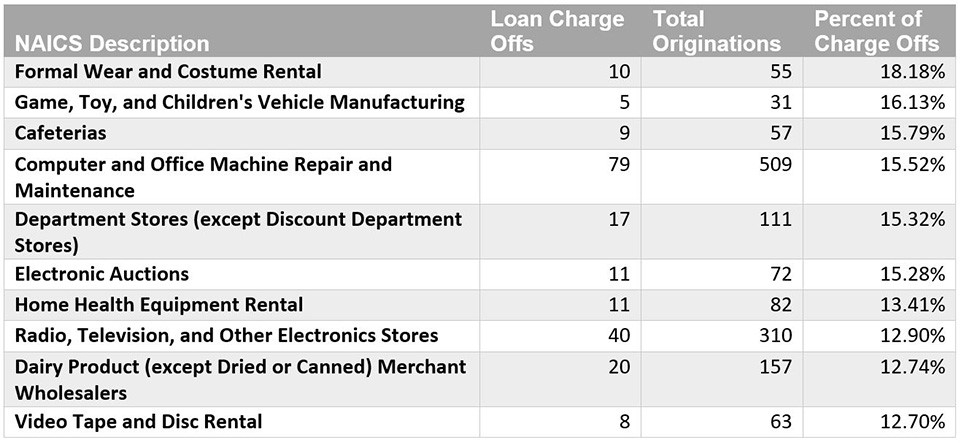
The next consideration was the number of charge offs based on NAICS code. The most popular industry for SBA originations was restaurants. Full-service and limited-service restaurants accounted for 8.6% of all originations. While accounting for a higher than average charge-off frequency of 10.6%, they did not have the highest charge-off rate. The table below highlights the top 10 riskiest industries based on charge-off percentage, with a minimum of 30 originations.
The data presented above references the need to consider the industry you are lending to, the local market, and the national economy. From our work with banks though, we find several drivers of success not reflected in these statistics that are relevant for all lenders.
Begin with indexing. It is the foundation in ensuring government guarantees remain intact and helps keep them from being repaired or voided. The recommended 10-tab format will not only help ensure required documents are obtained but also provide structure to the loan file. The SBA provides guidance regarding the documents that need to be indexed under each tab.
The second and third suggestions are no different for SBA borrowers and non-SBA borrowers. Continued monitoring of credits is imperative to risk identification. Continually collecting the required financial statements will give the institution insight into each borrower’s repayment capacity. Lastly, timely recognition of failing credits is vital. Once a credit has become impaired, it is important to follow proper guidelines as described in 7(a) Servicing and Liquidation. Examples include the lender performing a site visit after a loan becomes 60 days past due and the lender obtaining prior written SBA approval for servicing and/or liquidation actions.
The final variable that cannot be measured by a data point but has the most impact on a loan’s success is the borrower themselves. When you remove economic and geographic variables, a borrower’s success in business comes down to the acumen of its management team. Do they have a business plan? Do they understand the industry? Are they people of integrity? This is not to say good people do not take on bad loans, but answering yes to all these questions is a great start in avoiding a future charge off.
Once you comprehend your borrower’s industry and the economic factors at play, the next three steps are using the 10-tab template for indexing, completing comprehensive annual reviews, and being comfortable with the individuals to whom you are lending. After all that, you can finally rest easy about your SBA portfolio.
If you have any questions or need assistance, reach out to a professional at FORVIS or submit the Contact Us form below.
Percent of Charge Offs by Originating State