

A sales pipeline is a visual representation of where prospects are within a sales life cycle. It can provide an estimate of how much business your sales team expects to close in the next week, month, or year. Further, you can use the information to assess how much revenue might be coming into your business and when. Salesforce sales pipeline management tools, including Sales Analytics, have been built for direct sales professionals, e.g., sales managers and representatives.
Sales Analytics is an end-to-end analytics app that brings the power of Einstein Analytics to Sales Cloud. With intuitive visualizations based on Salesforce data, Sales Analytics lets you move from insight to action within a single application and can help sales teams use data to improve the sales pipeline.
It also builds helpful dashboards—using AI technology—that contain data sets based on your existing Sales and Service cloud data. Data sets include both standard fields from Salesforce objects as well as custom fields computed from your Salesforce data. You also can create your own lenses and dashboards in Sales Analytics. Check out the Sales Analytics Dashboard Guide to learn more about the available prebuilt dashboards.
Dive into Your Salesforce Sales Pipeline with Sales Analytics Trending Dashboards
One dashboard we’ll take a closer look at in this article is the Team Trending dashboard, designed primarily for sales managers. In it you can view company, team, and sales pipeline changes for a selected period, including pipeline beginning and ending values as well as Opportunities that have moved in and out.
It’s an interactive dashboard that can help track pipeline movement and changes. Within it, you can collaborate, create, and update Sales Cloud records. Here’s a high-level overview of how it can be used to help improve your Salesforce sales pipeline.
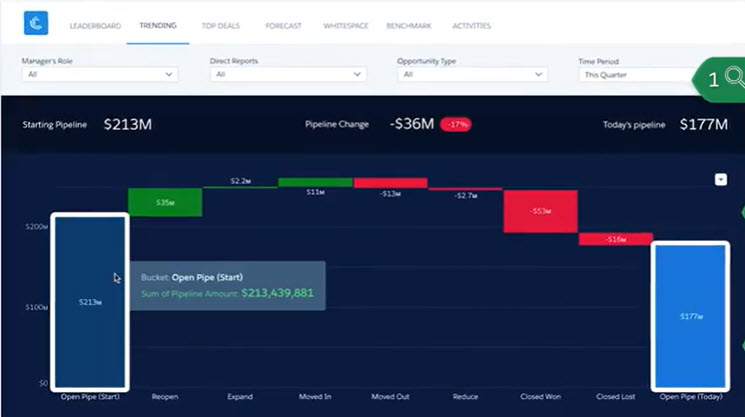
Step 1 – View pipeline changes. In the pipeline waterfall chart, select a desired time period. Moving from left to right, you can view what’s contributed to the sales pipeline.
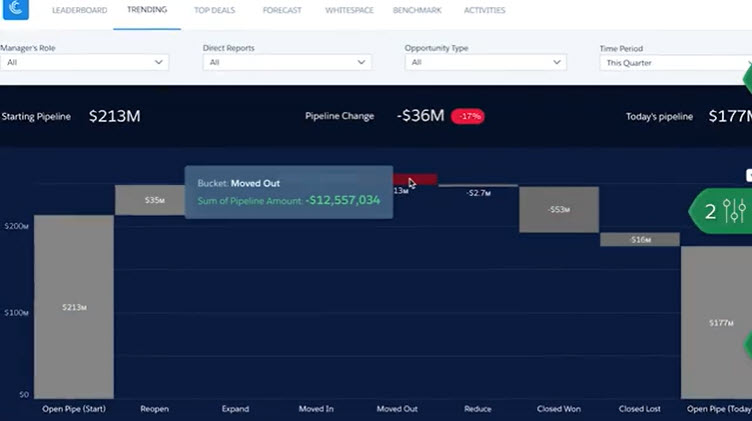
Step 2 – View individual Opportunity details. For example, click on the Moved Out category and scroll down to see a filtered list of Moved Out Opportunities sorted by amount. By reviewing the details of Moved Out Opportunities, you can develop an actionable list of Opportunities to revisit. Sales teams also can use this information to identify Opportunity areas that are more likely to grow the sales pipeline.
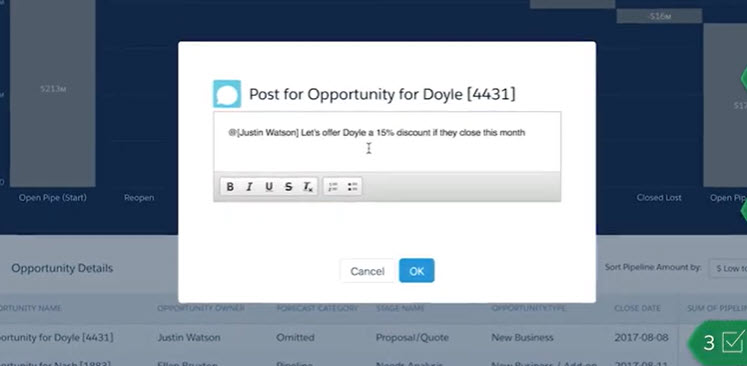
Step 3 – Take action. For example, from within this dashboard, a sales manager can click into a high-value Moved Out Opportunity and take an action—such as alerting the sales representative to offer a discount.
In conclusion, Sales Analytics can help improve your Salesforce sales pipeline by providing an intuitive way to track and manage your sales business. By helping sales teams gain real-time insights with out-of-the-box dashboards, Sales Analytics can assist professionals in meeting their goals.
For more information about Salesforce Sales Analytics, visit the AppExchange.
For help setting up Salesforce Sales Analytics, use the Contact Us form below to get in touch. With certified experience in Salesforce systems, the Business Technology Solutions team at FORVIS is ready to assist.