

Twenty-two years. That’s how long it has been since the Fed funds rate was 5.50%.1 Save for a brief period before the COVID-19 pandemic, cash has yielded roughly 0% since the end of the global financial crisis in 2009. The sharp increase in short-term rates over the past 18 months made T-bills, CDs, and other short-term investments a viable destination for cash. Another effect of recent rate hikes is the inversion of the Treasury yield curve, where short-term rates are higher than long-term rates. Three-month Treasury bills yielding 5.40% versus 10-year Treasury notes yielding 4% has many investors asking why they should commit to the longer maturity. This article will address that question and why long-term investors should be wary of the cash trap.
Historically, an inverted yield curve signaled that monetary policy was too tight. Investors would worry that high short-term rates would lead to a recession and begin pricing in a reduction in rates. This would lead to long-term rates falling in anticipation of a Fed policy change. In the post-COVID world, normal economic signals are scrambled. Debate rages on whether the inverted yield curve signals a recession. Whether a recession occurs or not, the bond market is pricing in lower short-term rates in the future. This has increased the risk of long-term investors falling into the trap of investing cash in short-term instruments at today’s higher rates.
So, what is the “cash trap?” The cash trap describes the risk of investing in short-term bonds or cash instruments at higher rates that ultimately prove temporary. The Federal Reserve eventually cuts rates, and the high short-term yields disappear. Because the securities have short maturities, falling rates do not lead to material price appreciation. Once the securities mature, the cash flow stream withers and investors are left with a much lower return outlook. However, if investors lock in longer-term rates, unlike the short-term options, the yields do not go away. Not only does the cash flow stream stay steady, but the reduction in market rates also leads to price appreciation. The result historically has been significantly higher returns on longer-term securities, despite the lower starting yield. As shown in the graph below, after the previous seven Fed hiking cycles, returns in municipal bonds (one example of a longer-term security) are well ahead of three-month T-bills in the subsequent six-month, one-year, and three-year periods.
Investors need to heed the risk of falling into the cash trap. Investing should be focused on building a portfolio that meets long-term goals. While the allure of short-term investments providing the highest yield is hard to resist, the use of these assets needs to be reserved for one’s savings.2 The highest current yield is not always the best choice in the long run.
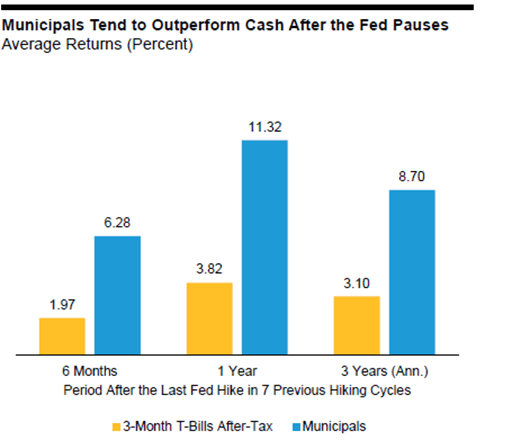
Source: Alliance Bernstein3
If you have any questions or need assistance, please reach out to a professional at FORVIS or use the Contact Us form below.
- 1“Fed Hikes Interest Rates to 22-Year High,” axios.com, July 26, 2023.
- 2Savings is defined as cash set aside in safe, liquid assets to provide a safety net or achieve short-term goals.
- 3Three-month T-Bills represented by the ICE BofA Three-Month U.S. Treasury Bill Index. Municipals represented by the Bloomberg Municipal Bond Index. Tax rate used: 40.8%. Returns are the average returns for the periods following the last hike in the Fed funds rate in the previous seven hiking cycles by the Federal Reserve. Start dates were August 31, 1984; September 30, 1987; February 28, 1989; February 28, 1995; May 31, 2000; June 30, 2006; and December 31, 2018.