

Managing a higher education institution is complex. Consider the following features of a college or university:
- Shared governance
- Trustees (key leaders) who are volunteers rather than owners
- Complex revenue structure (earned income, donated income, passive income)
- Abstract primary product (educated and mature students)
- Multiple additional products that may or may not produce net revenues (research, public service, athletics)
- Product delivered by those who are disconnected (faculty) to the fiscal drivers (tuition and fees)
- Revenue providers (major funders including donors and, in some cases, governmental entities) that may have their own priorities for the educational institution
These and other features of the anatomy of higher education institutions make them hard to understand and challenging to manage.
With this complexity in mind, it is important for higher education chief executives to find ways to simplify the communication of fiscal- and mission-related achievements. In this article, only fiscal achievements will be discussed.
Volunteer board members with limited time and often limited understanding of the complexity of colleges and university operations need three things related to financial results:
- Simplicity
- Contextual understanding
- Direct, clear communication
Delivering Simplicity
To bring simplicity to fiscal affairs in a college, answers to only four questions need attention:
- What drives our economic model?
- Do we have adequate liquidity?
- Are we earning adequate margin on our core operations?
- Is our capital structure adequate for our size entity?
Economic Model
Anyone reading about higher education these days has likely encountered the phrase, “the economic model is broken.” This statement refers to the fact that tuition rates are as high as most families can afford (even with debt) and maybe higher. This factor prohibits most schools from substantial price increases.
The discounts schools are willing to take to acquire a freshman class each year continue to rise, yielding less net tuition revenue per student and in total.
In addition to pricing and discount trouble, the demographics for college-going students are shrinking overall and falling rapidly in some parts of the country. That decline is expected to accelerate around 2025 and continue through 2034 with a temporary, incomplete recovery in 2031 and 2032, according to the Western Interstate Commission on Higher Education (WICHE) and author Dr. Nathan Grawe (Demographics and the Demand for Higher Education).
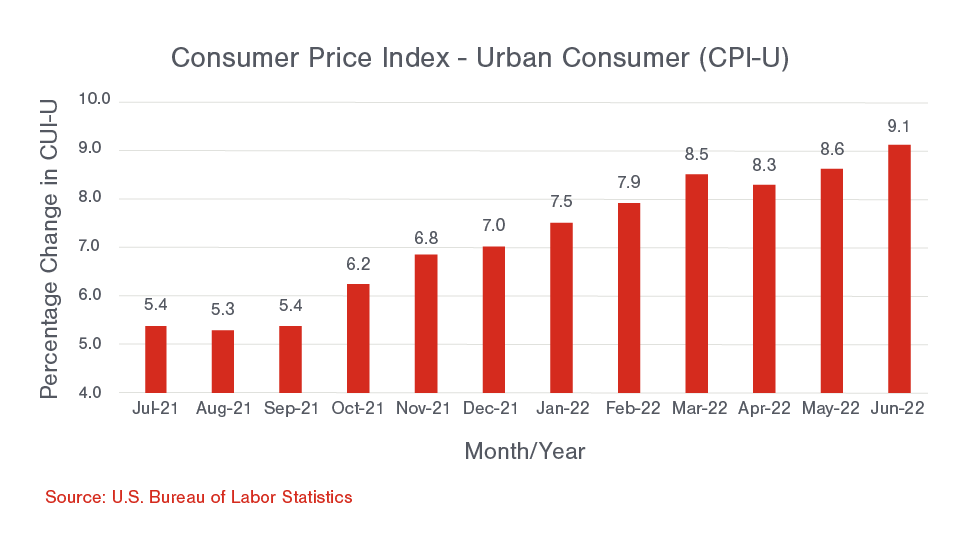
Combine reduced net tuition revenues with rising costs, and it brings the phrase “broken economic model” into focus. Currently, the Consumer Price Index for Urban Consumers (CPI-U) stands at 296.311, having risen 9.1% in June 2022.
Table 1
Research most small to midsize public or private colleges, and you will find many with limited reserves, small endowments, and less contribution revenue than what is needed.
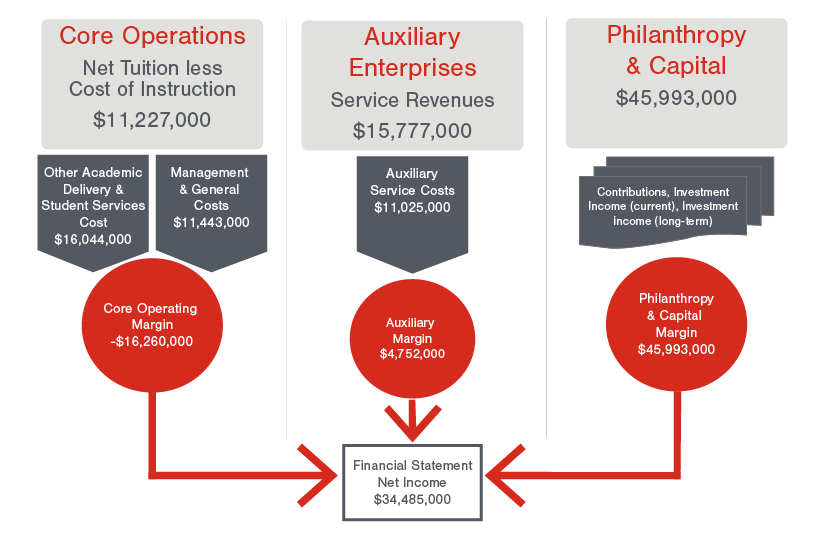
A current problem with this, however, is the perception of generally good financial results achieved over the last couple of years because of substantial investment gains and governmental funding tied to the pandemic. In addition, at some schools, one-time gains from assets sales and recent fundraising success have hidden core operating deficits. Table 2 below illustrates this well. It is based on real financial statements in 2021.
Table 2
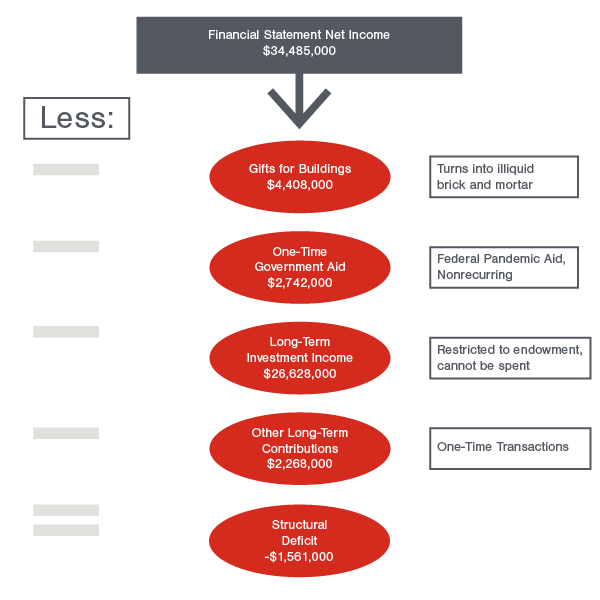
These results from the 2021 fiscal year look great, until you peel back the impact of one-time events, restricted funds, and investment gains that cannot be spent. When you do further analysis (Table 3), you see a structural deficit in the amount of ($1,561,000).
Can the average trustee board member pick this out? Most experienced assessors would say no. Therefore, it is important to help your trustees see a picture of the economic model clearly. Potential problems are not always visible in the numbers as presented in external financial reports.
One way to demonstrate these issues for trustees is to simplify the presentation of the college or university income statement by presenting the activity in three sections as illustrated in Table 2: Core Operations, Auxiliary Enterprises, and Philanthropy and Capital. If you are in a public university, clearly segregating governmental support will allow you to also see the governmental subsidy clearly. If you are a research institution, research can be classified into the second category (auxiliary enterprises).
Few readers of external financial statements recognize when a structural deficit exists. This method of displaying the economic model will help board members understand that academic and student service costs require subsidy in most cases.
When there is balance between philanthropy and endowment return and the amount of the subsidy required, there are typically surpluses at the bottom line. When subsidies from fundraising are not enough and investment market performance declines (sometimes for consecutive quarters or years), it becomes clear that the only way to resolve issues quickly is to work on the core operating margin through increasing net revenue (which is sometimes a very slow and risky process) or streamlining academic delivery, student service, and administrative costs.
Table 3
Liquidity
Liquidity is the life blood of any organization. When there is adequate liquidity, there is enough cushion to absorb the occasional financial “dry spell.”
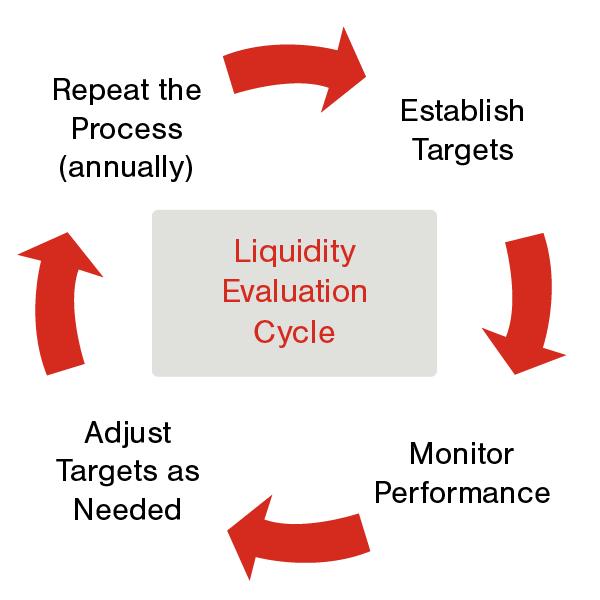
When it comes to delivering simplicity in liquidity, four actions can help:
- Establish appropriate targets for cash and overall liquidity (which would include lines of credit). While doing this, encourage the board to establish policy to provide guidance for the level of liquidity it is comfortable with. The board’s risk appetite will have a bearing on this amount.
- Monitor performance. Monitoring performance includes establishing the initial target and then watching the actual performance.
- Adjust the target as needed and repeat steps one and two.
- Repeat the four-step cycle annually.
Table 4
A good starting place to establish the amount of your current liquidity is to review the external financial statement footnote on liquidity. The decision on how much is enough will depend on the risk tolerance of those in senior leadership and on the board of trustees. This decision can be informed by a study of peer institution liquidity amounts. Use of the federal clearinghouse is a good starting point for research into school liquidity footnotes.
Margin
The truism related to this idea of margin is: No margin, no mission. But what “margin” are we talking about? Does this mean positive cash flow? Accounting net income? Budget surplus? Or some other idea that indicates surplus? All these ideas have merit, but for teaching institutions, the main focus should be on core operations.
As demonstrated earlier (Table 2 and 3), you can have accounting net income looking healthy only to find out there are ongoing structural deficits. When a finance team and executive leadership focus on how to efficiently deliver a high-quality academic product, then balance that with the ability of the school to attract philanthropy (giving) and capital investment (endowment), the issues around how much margin in our core operation is needed provide definition to what kind of margin is required from core operation. Core operations in a teaching institution is defined as net tuition from students and the costs of delivering instruction and supervising that activity.
To facilitate net margin review, it is helpful to have good analytic tools ready to review core operations to help determine what programs, departments, courses, instructors, etc., are creating margin and where adjustments are needed. Adjustments take both positive and negative forms. The positive form of adjustments includes additional funding for high-demand, high-margin areas. The negative adjustments are represented by small-enrollment courses, departments, or programs that do not bring significant missional value to the institution. Those are often the most difficult decisions to make. Many times, they exist because of changing student demographics and demand. Table 5 illustrates the broad range of results in a typical teaching institution.
Table 5
Capital Structure
Capital structure analysis is complicated because it is individualized by institution. One school may have higher net tuition, reducing the need for endowed resources, while others have very low net tuition, increasing the need for endowment-funded revenue streams. Debt also is part of this capital structure concept. Some schools are comfortable with long-term debt (especially when it funds income-producing facilities like dorms and food service or sometimes athletic facilities). Others would rather invest donated capital resources in buildings and grounds knowing that those buildings are helpful in attracting paying students. There are many schools with attractive new facilities and little to no debt because their approach to raising capital through fundraising focused on building and grounds. Likewise, there are numerous small schools with large endowments (capital) that subsidize lower net tuition costs to students. The important idea here for leadership is to be sure the questions about “what kind” and “how much is enough” are answered. Financial modeling software comes in handy when doing these evaluations to enable leaders to clearly see the impact of different scenarios.
Finally, policy definition is important for these decisions regarding how much is enough and what the structure should look like given a school’s history, background, and leadership philosophy.
Encouraging Contextual Understanding
As stated earlier, volunteer board members—while very smart, successful people—many times lack contextual understanding about the inner workings and economic drivers of a college or university. Providing them with models of financial performance like the illustration in Table 2 will help their understanding. Bring education sessions to their regular meetings to help them understand:
- Enrollment trends and what makes them move up and down
- Higher education economic models
- Benchmarks and relevant key performance indicators
- The uniqueness of nonprofit accounting
- How academic quality is measured and monitored
This work can be supported by cabinet-level administrators with regular education and training. Good external advisors being used by the school for audit and other professional service functions also can help.
Communicating Clearly
The final—but not the least important—part of helping boards increase understanding and engagement is the communication effort brought by outside advisors and administrative leadership. Well-planned and executed meetings full of good data and better explanations will yield an informed and engaged board.
This level of communication does not happen by accident. It is not episodic (left to one meeting a year). Good communication is a constant effort to inform and clarify (sometimes emphasize) matters that need the attention and best thinking of the governing board.
Boards are most effective when they feel comfortable with the data they review and when they understand the trends and the underlying context creating those trends. Good board reports normally include:
- Trends (three to five years and sometimes more)
- Benchmarks (both internal and external)
- Distance to goals (past, current, and expected)
Summary
Because the management of a college or university is inherently complex and the current economic climate creates challenges, an effort to increase the knowledge and effectiveness of the governing board can yield positive results, including board economic and moral support and a legacy of good, well-informed decisions.
Reach out to a professional at FORVIS or submit the Contact Us form below if you have questions.