

One of the hot trends for years has been the use of dashboards to monitor key metrics. Dashboards have the benefits of visualizations. If you see a bar chart called Revenue by Month and see the bars getting progressively higher, it’s fairly easy to understand the data at a glance.
Power BI from Microsoft is a well-known solution that enables you to create dashboards. You may ask, “What exactly is a dashboard? I already have a bunch of reports. What’s the difference?”
What Is a Dashboard?
Think of your car’s dashboard, which shows key items that are important for drivers. Want to know your speed? How about your gas level? You might consider those items key metrics.
Think of all the systems in your car that are monitored by a computer. Not every piece of information monitored in your car is displayed on the dashboard. Take your car for service, though, and the technicians will look at the information that is monitored.
In business, it’s a very similar concept. If you’re the sales manager, there are many reports you may view, but there may be a limited number of metrics you need to track on a daily basis. If you’re running a factory floor, you may ask for detailed reports, but there are certain items you need to know at a moment’s glance.
According to Microsoft, a dashboard is a single page that uses visualizations to tell a story.
How Do You Create a Dashboard in Power BI?
There are some specific steps to create Power BI dashboards. To start, you’ll want to consider the business story you can share with Power BI report data.
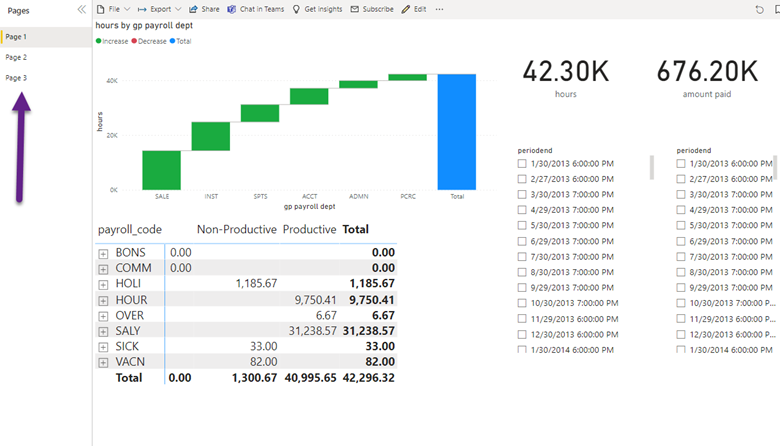
In Power BI, you can build multiple pages of visualizations. One page might have five visualizations. Another page might have two visualizations.
Notice there are three pages in the image below.
To create a dashboard, here’s what to do:
- Publish the report to the Power BI service.
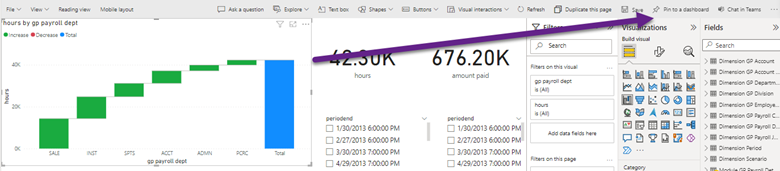
- Edit the report.
- Select a visualization (generally, a chart type).
- Select the Pin to a dashboard option.
- Add the visualization to an existing or new dashboard.
Using the Dashboard
Now that the dashboard is created, you have a few ways to view it:
- Use the Power BI service.
- Use the Power BI mobile app.
Make note of the fact you need a Power BI Pro or Premium license to use the Power BI service and dashboards.
Power BI dashboards also have other features. Learn more about Power BI dashboards here.
Tell Me More!
Now that you know more about Power BI dashboards, you may have questions. FORVIS has professionals who can aid you with creating and using Power BI dashboards. Reach out to a professional at FORVIS using the Contact Us form below or contact our corporate performance management (CPM) group.