

You can learn how to answer your own pressing business queries in minutes with Solver’s Ad Hoc reporting.
Ad Hoc reporting gives Solver users the ability to answer business questions quickly. Whenever new questions arise or additional detail is needed, users can create their own customized Ad Hoc report that leverages warehoused data that is integrated with the Solver corporate performance management (CPM) solution.
What Is Ad Hoc Reporting?
Solver’s Ad Hoc reporting is a tool for finding information. It allows users to quickly create a report using the data and filtering criteria they select. Whenever new questions arise or detailed information is needed, users can create an impromptu Ad Hoc report without having to rely on other teams for assistance.
Ad Hoc reporting can save hours of time and effort. Sending data analytics requests to various departments and employees to manually compile a report can be time-consuming. Instead, a Solver user can create a report autonomously. This can considerably shorten the workflow for new analytics and insight.
How to Use Ad Hoc Reporting
Ad Hoc reporting is available to Solver live and power users; it is not available to archive users.
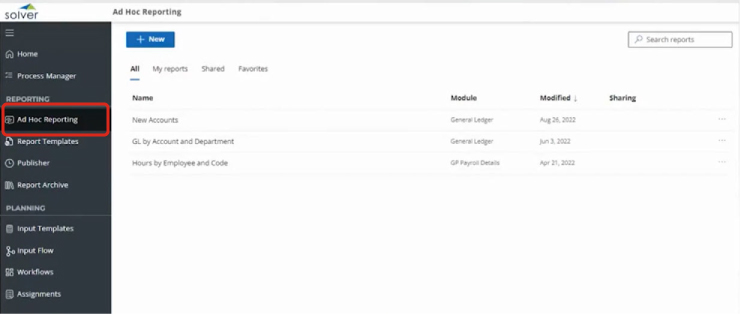
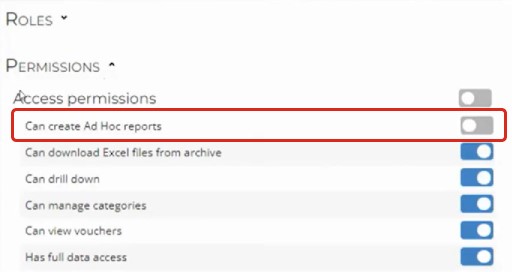
If you don’t see Ad Hoc Reporting in your navigation pane, as shown above, you may need your administrator to enable this option under Settings > Administration > Users/Roles > Permissions.
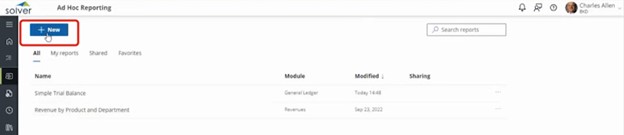
To create a new Ad Hoc report, click the Add New button near the top of the screen.
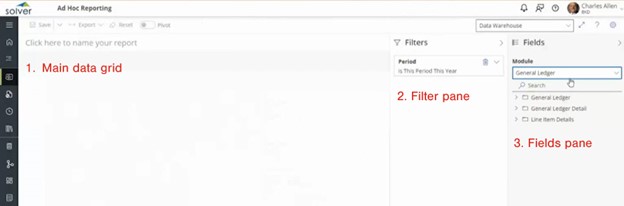
The new report layout screen has three areas:
- Main data grid
- Filter pane
- Fields pane
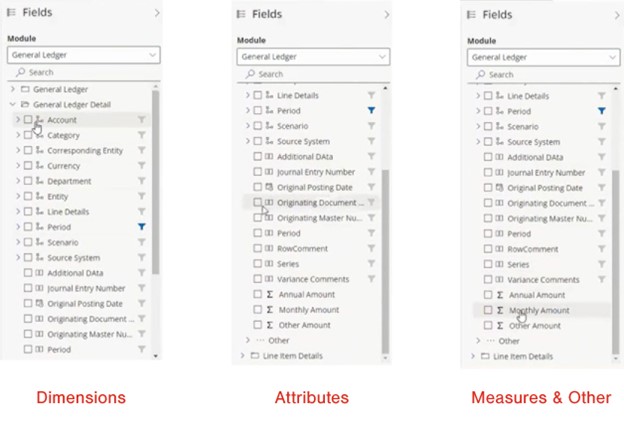
Click to expand the modules available to you in the Fields section. Click on the dimensions and attributes that you want to be brought into the report. (Learn more about dimensions and attributes in Solver here.)
Dimensions automatically become columns and filters. Attributes nested under modules and dimensions also become columns in the main data grid—and are not listed in the filter section.
For this example, we’ll focus on general ledger data. Click on General Ledger Detail to expand the dimension, attribute, measure, and other options.
Select as many fields as you’d like and click Refresh in the bottom right corner of the screen.
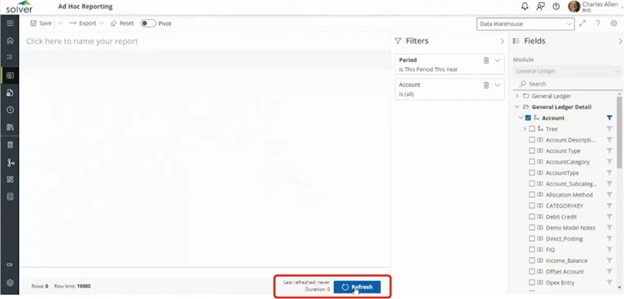
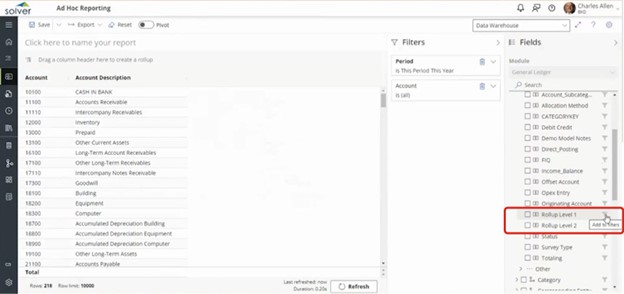
The data grid populates with the data you have selected.
To apply a filter, click on the field for which you’d like to apply a filter.
Once you’ve added your filter criteria, click Refresh to apply the filters (example below).
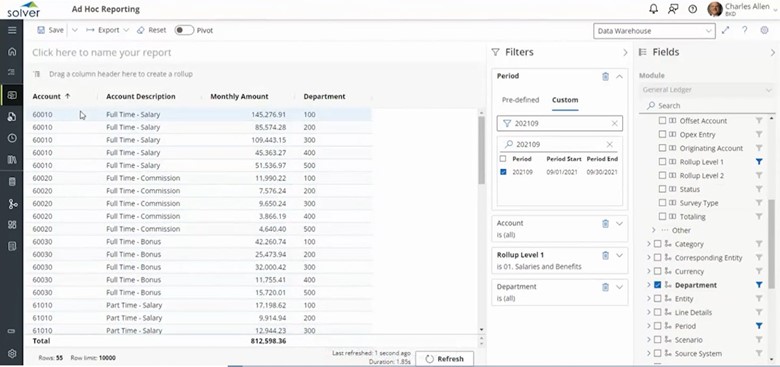
To group or sort by a specific field/column, drag the column header up to create a rollup/grouping. Check out this 33-second video clip to see how to do this.
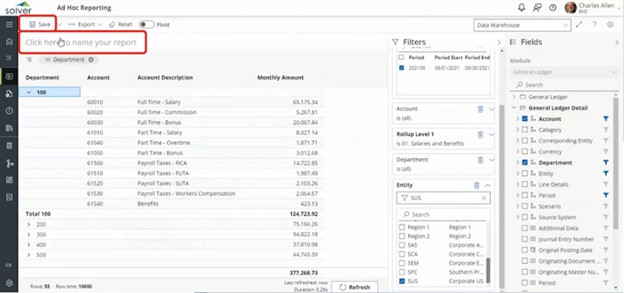
If you want to save the report for future use, enter a name in the “Click here to name your report” field, and then click Save.
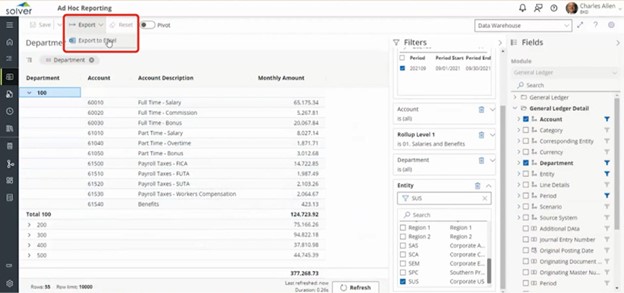
You also can export the data to Excel.
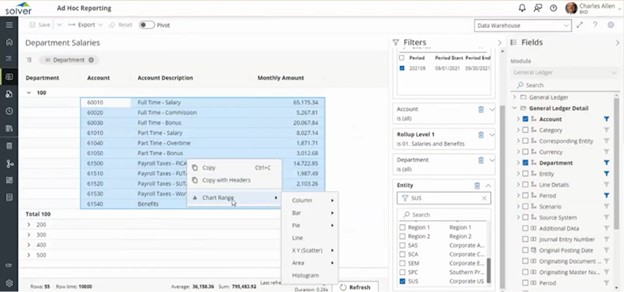
In addition, you can create simple visualizations and export those as well.
If you’d like to learn more about Ad Hoc reporting and other Solver features you may not be using yet, check out our informative video presentation here!
The Business Technology Solutions team at FORVIS is ready to assist you with your CPM and reporting and planning processes. Use the Contact Us form below to get in touch.