

The Solver Data Warehouse can be used as a data source for Power BI. By using the Solver Data Warehouse (DW) as a data source, you can gain these advantages:
- Less reconciliation required between report types. Using a single data source helps keep data consistent and can reduce the reconciliation of reports between the systems.
- A consistent data structure. A consistent data structure provides users with familiarity of the data, increasing the efficiency of writing reports. The data will look the same in both systems, so users won’t have to learn two different data structures.
- Reduction in data modeling efforts. By using the Solver DW as a data source, the data structure will be consistent and users won’t have to recreate the wheel, so to speak, in Power BI.
Requirements for Using Solver as a Data Source
To utilize Solver as a data source, you need to have the Power BI connector from Solver. Once you have the connector license, you can set up Solver to be used as a data source. To do this:
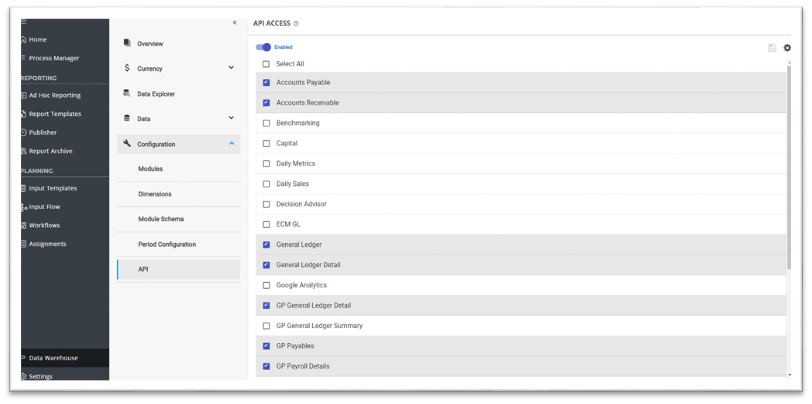
- Go to the Data Warehouse
- Select Configuration
- Select API
- Toggle the Enabled switch
- Select the modules to be available in Power BI – When you select a module, all dimensions used by the module become available, too
Getting Data in Power BI
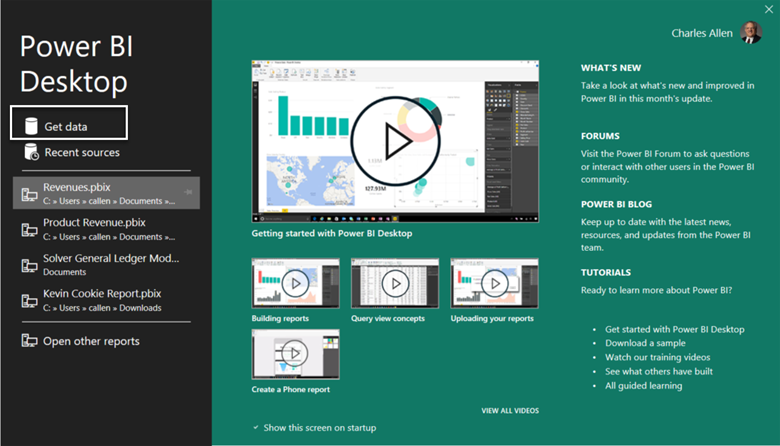
Now that you’ve enabled Solver for use with Power BI, it’s time to switch to Power BI to get data.
Select Get data from the startup menu.
Enter Solver in the search box.
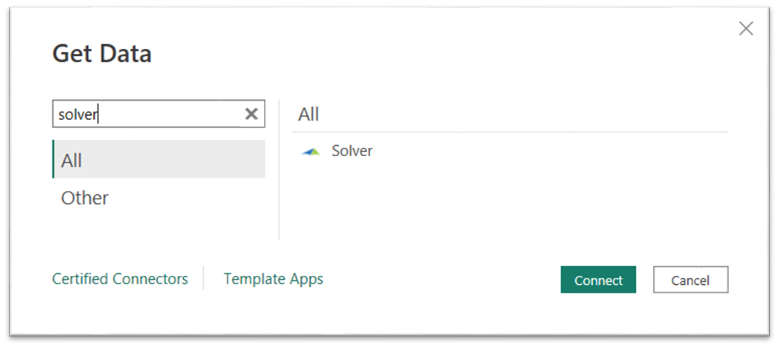
Select Solver on the right.
Click the Connect button.
You’ll get a message requesting an API URL from the Solver Portal.
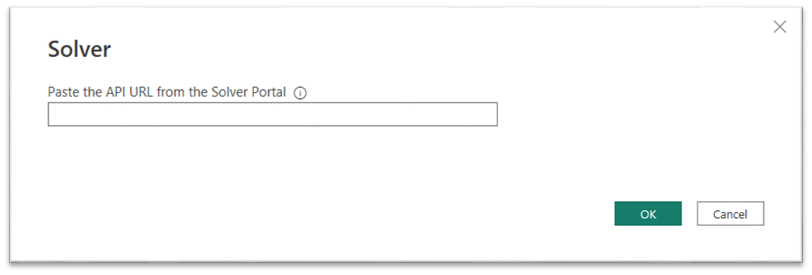
Go back to the API page in Solver.
Select the gear icon at the top right.
![]()
Copy the URL that appears.
Paste the URL into the field in Power BI.
If you have never used Solver with Power BI on your computer, you will get an authentication message.
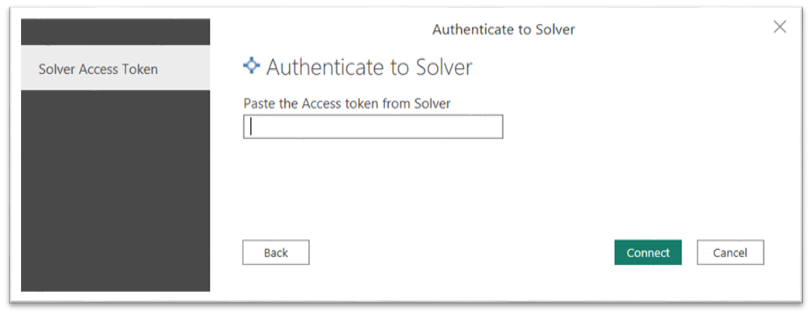
Go back to Solver and select the gear icon a second time.
Copy the Access Token.
Paste the information into the field in Power BI.
Then, a list of tables will become available.
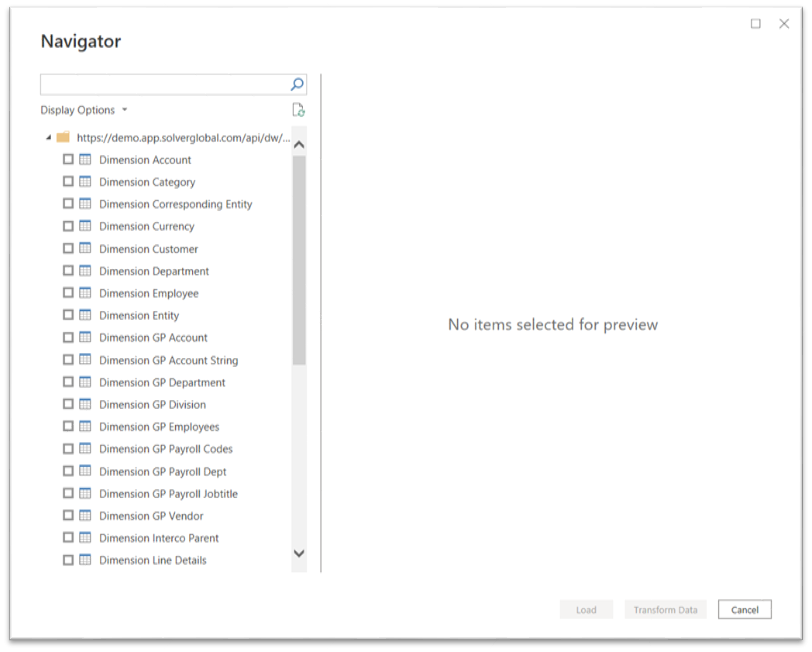
You may select as many tables as you want.
Recommended best practice: Only select one module table per Power BI report.
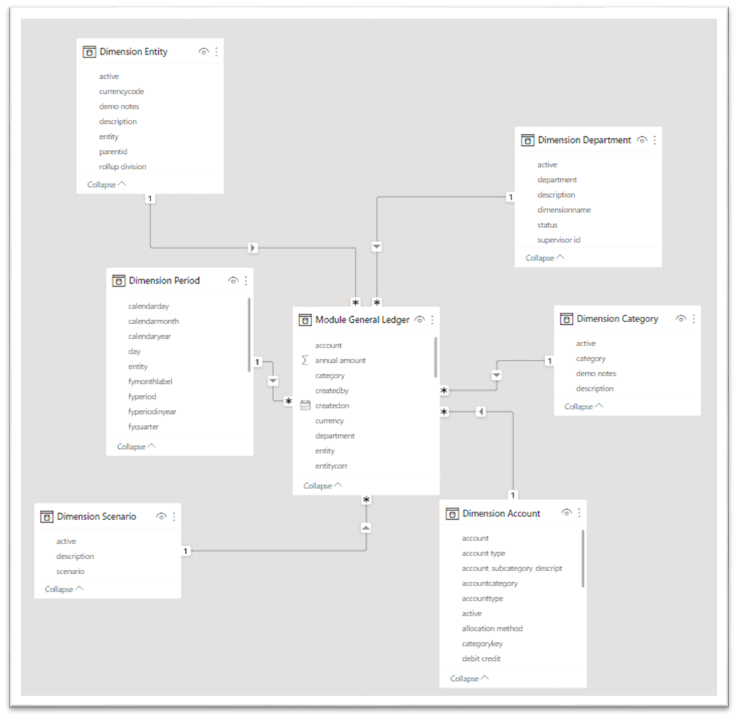
For example, for General Ledger, you might select these tables:
- Module General Ledger
- Dimension Account
- Dimension Category
- Dimension Department
- Dimension Entity
- Dimension Period
- Dimension Scenario
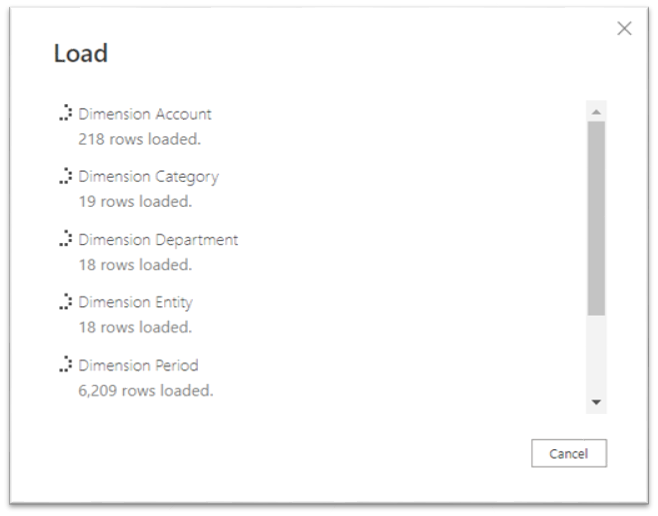
After you’ve selected your tables, click the Load button.
Note: Solver uses an import method of connecting. Therefore, the speed of loading data can vary based on how much data you have and how fast your connection is. In other words, don’t be in a hurry.
Here is how the tables will appear:
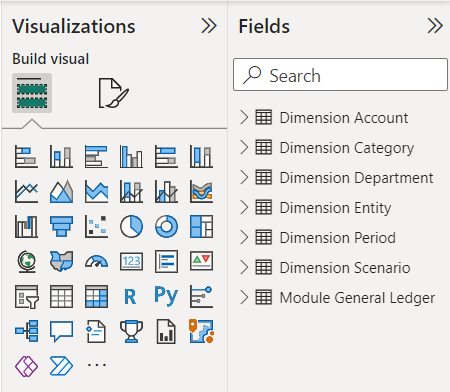
If you select the Data Model icon on the left, you’ll see this data structure. Notice the dimensions are joined already to the module.
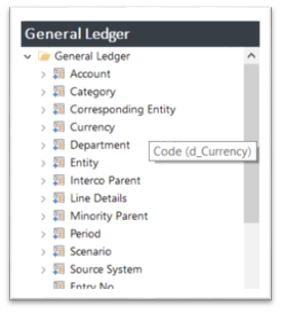
Below is how the data will look in Report Designer.
The items with arrows are the dimensions. We didn’t select all dimensions available so some of the dimensions in Report Designer are not showing as tables in Power BI. However, you could certainly add more dimensions. Use the Get Data button at the top to get more tables.
Moving Forward
Now that you have data, the next step is to create a report. The Business Technology Solutions Team at FORVIS can assist. Our professionals have certified experience with Solver corporate performance management and Microsoft Power Platform software. Use the Contact Us form below to get in touch.