

The Fixed Asset Management functionality in Microsoft Dynamics GP enables users to manage assets. It provides many features and reports. However, some users want different reports than the standard reports. Providing users with an easy-to-use tool to create reports on their own is important. This article will examine how to create fixed assets reports for Dynamics GP with Solver.
What Is Solver & the Hybrid Cloud Connector?
Solver is a Microsoft cloud-based reporting and planning solution. It has been available for many years. One of FORVIS’ clients has used it for more than a decade and some organizations have used it longer. It provides users a secure location to store and run report templates. These templates can be created by using Excel and an add-in that gives users drag-and-drop functionality for adding data fields to spreadsheets.
The Solver Hybrid Cloud Connector is a prebuilt connector that enables reports in the cloud to operate with Dynamics GP databases. It provides access to all modules and tables in GP. In addition, if you create custom tables and views, you can use them for reports.
Here’s an illustration of the solution:
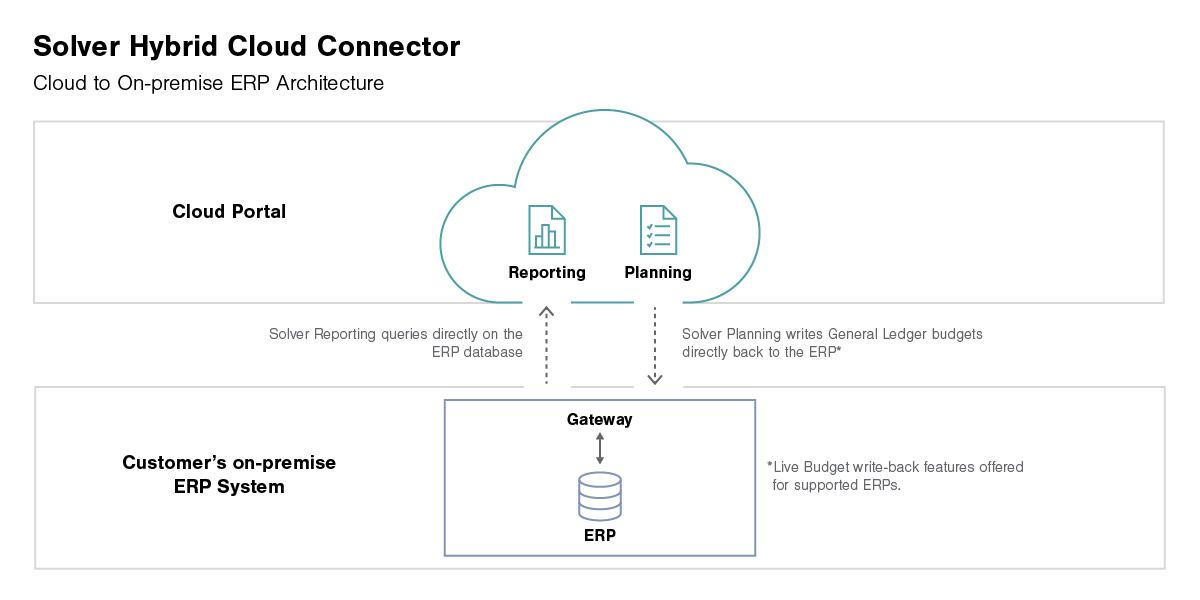
Notice the bottom of the illustration depicts the enterprise resource planning (ERP) system, which will be Dynamics GP in this case. Above it sits a gateway (service) that runs on your Dynamics GP server. In the cloud, the reports operate through that gateway to access live data.
How to Create a Report Using Solver
Here are the basic steps for creating a report:
- Log into Solver.
- Select New to create a report.
- Design the report in Excel.
- Save the report, which saves it in the portal.
- Share the template with end users.
That’s it!
What’s the advantage of this solution over tools such as SQL Server Reporting Services (SSRS) and SmartList Builder?
Solver & SSRS
- Business users are generally much more familiar with Excel than the SSRS Report Builder.
- Solver provides familiar table descriptions instead of SQL table and view names.
Solver & SmartList Builder
- Solver enables users to create reports with headers, footers, and totals.
- Users familiar with Excel can use that knowledge to create reports.
Let’s see it!
To get rolling, this section is starting with Step 3 from the five-step list above. Notice the next screenshot displays an empty Excel spreadsheet and the Solver Report Designer pane with Fixed Assets tables visible.
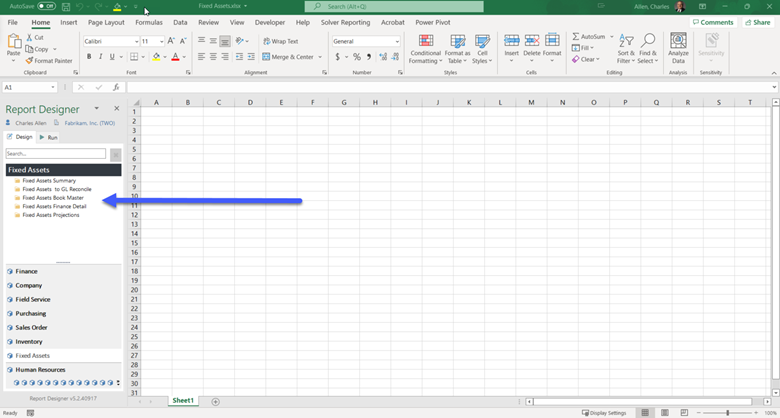
The report that will be created will display Projection information.
Opening the Fixed Assets Projections folder displays a list of fields that can be used in the report. Notice that some of them have arrows in front of them.
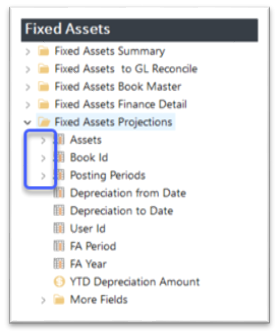
The arrows mean you can open those items and get additional fields to drag into the report. For example, the asset description and class can be pulled from that section. Lastly, you will notice “More Fields” at the bottom, which gives you access to even more fields.
For this report, fields will be grouped by Asset Class. To do that, we’ll expand the Assets group and drag Class ID to the report. Dragging the field into the report creates a grouping.
A couple of rows down, we’ll drag the following fields:
- Assets (the Asset ID)
- Asset Description
- Depreciation From Date
- Depreciation To Date
- YTD Depreciation Amount
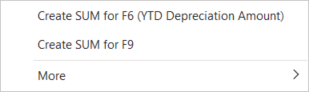
You’ll need totals so we’ll use an option to create a SUM function.
For formatting, use the knowledge of Excel you already have. Use the formatting functionality in Excel.
Once it’s finished, here’s the report design.
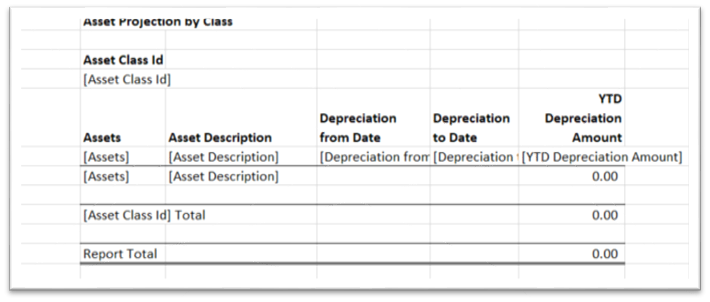
Save the report and close Excel.
Here’s the report in the portal:
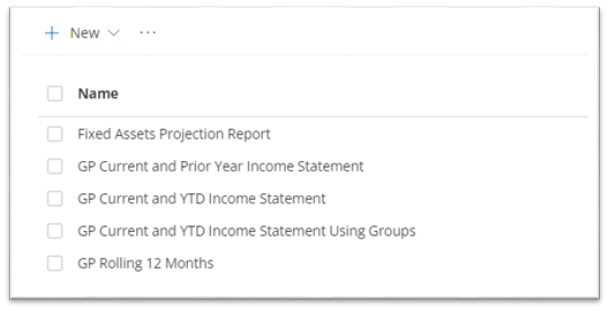
To run the report, select the name of the report.
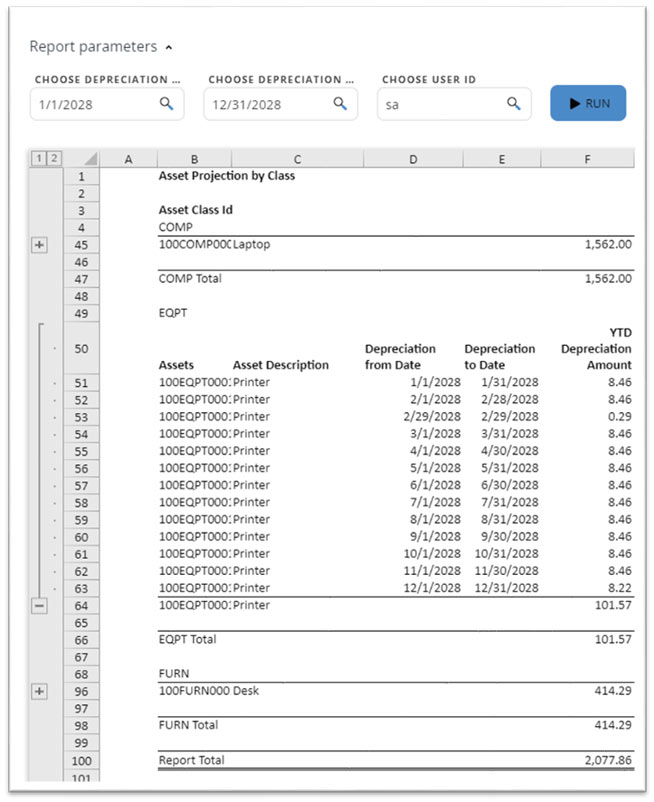
Enter the parameter values. (The parameters were added in the report design.)
Select Run.
Then, you can do one of these things:
- Share the report results with others.
- Archive the report results for later viewing.
- Export the report to Excel.
That’s it! Now you have an idea of how to create fixed assets reports for Dynamics GP with Solver.
Conclusion
This example shows how a custom report can be created using Solver. Further, it’s important to note that something that delivers a lot of value doesn’t have to be difficult to create. The purpose of Solver is to enable business users who understand the data and know how to use Excel to create reports.
Using the Hybrid Connector, report designers can create reports that have live access to Dynamics GP data. Reports can be run in the portal as long as you have an internet connection and a browser. You can share the report results with others and export the data to Excel.
For more information about Solver, connect with a professional at FORVIS or use the Contact Us form below.
Related reading: “Microsoft Dynamics GP & Solver for Advanced Reporting”