

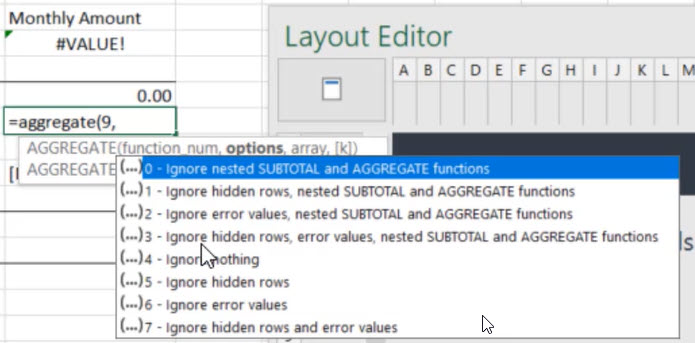
In database management, an aggregate function is a function where values of multiple rows are grouped together to form a single summary value. There are nearly 20 functions available to perform with the aggregate function in Excel. Common aggregate functions include:
- Sum
- Average
- Median
- Count
- Standard deviation
- Maximum
- Minimum
- Range
In this tutorial with video, we’ll show how to use the aggregate function in Solver with Excel to run an expense report efficiently.
Start by using Solver in design mode. Solver uses Excel as its Report Designer tool. In this example and shown in the video below, we open a basic financial statement and use the aggregate function to find total expenses.
Aggregate Versus Sum
The aggregate function gives you options that sum functionality does not. With the aggregate function, you can exclude values like nothing, error, etc.
This functionality can be quite helpful when running reports that include multiple departments (or sections). Some departments may have expenses that others do not. In this scenario, the sum function may result in an error because particular values may not exist. By using an aggregate function instead, the report will only add the values that need to be summed.
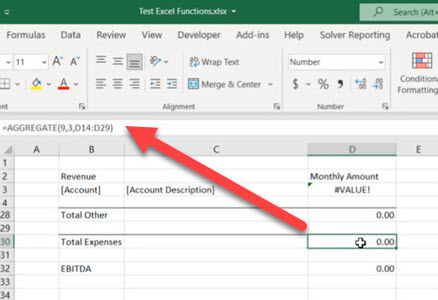
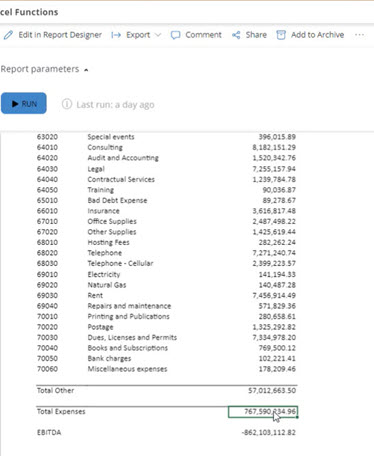
Here’s the finished report using the aggregate function:
Short Video
Watch this short video to learn how to use the aggregate function in Solver.
The Business Technology Solutions Team at FORVIS has certified experience with Solver and Microsoft business applications. We are a Microsoft Dynamics Gold Partner and 2022–23 recipient of the Microsoft Inner Circle award, in addition to the Solver Evangelist of the Year award. Connect with us and let us know how we may assist you with your reporting and planning needs and goals.