

Sage Intacct is a great enterprise resource planning solution with a lot of reporting and dashboard functionality included. However, there are organizations interested in using Power BI for dashboard reporting. There are options for how you can access your Sage Intacct data in Power BI.
Why Power BI?
First, you may wonder why Power BI should be considered for creating dashboards. Power BI provides interactive dashboard capabilities that can be used across devices. Develop them on your desktop and share them to the Power BI website. Once reports are shared, they can be viewed in a browser or a device like a smartphone or tablet. You can read more about Power BI on the Microsoft site.
Power BI comes in various license forms. Power BI Desktop is a free download from the Microsoft Store or the Microsoft Power BI website. Once you get Power BI Desktop, you have the first part covered.
The next step is the data from Intacct. That’s where you have some options.
Getting Data
There are several options for using Intacct data in Power BI, including:
- Exporting data to files
- Special drivers from CData (Real-Time Data Connectivity – CData Software)
- Import data into a Data Warehouse (DW)
There are various ways to export data. You can run reports and export the data to files. You can use automation to pull data from Intacct and push it to Power BI or files. However, if you’re exporting data from reports, then somebody must do it, which introduces a problem with the data’s timeliness. If you use automation, somebody must build the automation.
Another option is a set of drivers from a company named CData. CData has published data drivers for a while and offers Power BI connectors for Sage Intacct users. The connector enables you to select Sage Intacct data from within the Power BI Get Data functionality. Go to Power BI Connectors | CData Software for more information about this functionality.
A third option is to use a DW into which Intacct data can be automatically loaded and then serve as a data source for Power BI. A DW offers many features such as a well-structured, understandable, and scalable data model. Because Power BI depends upon such a data model for creating reports that run efficiently, you have the advantage when it comes to large data sets.
A DW Option
A DW is, essentially, a database that is made for reporting. There are different ways of constructing a DW data model. The ideal method for Power BI is a star schema. Read this Microsoft article on why a star schema is important for Power BI: Understand star schema and the importance for Power BI - Power BI | Microsoft Learn.
You can build your own DW or purchase one. Many of our clients use a prebuilt DW from Solver Global. Solver publishes the Solver Corporate Performance Management solution. It includes reporting and budgeting. Here are some advantages Solver brings to the table for Intacct:
- Single tool for combining various data sources, like Intacct and Payroll
- Advanced planning, consolidation, and reporting capabilities
- Access to all Intacct data exposed by the API
- Cloud-connected Excel report design with a web portal for access to reports and planning templates
However, you may only be interested in the DW functionality. We have had clients purchase it for that purpose. Solver’s DW is a star schema and Solver is a data source for Power BI.
Here’s how it looks:
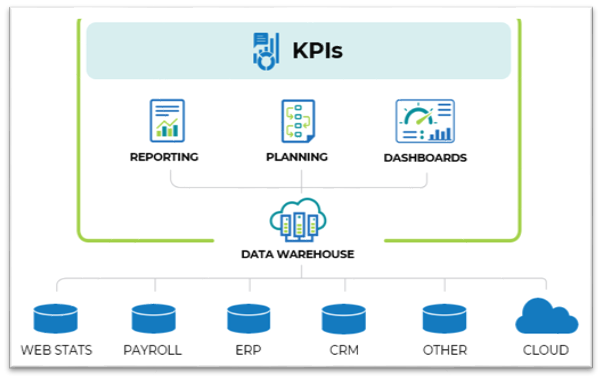
The data from Intacct can be fed on a recurring basis to automate the process. Once the data is in Solver, you can start building Power BI reports. Watch our webinar, “Solver Power BI Series Episode 1: Getting Data,” to see how Solver serves as a data source for Power BI.
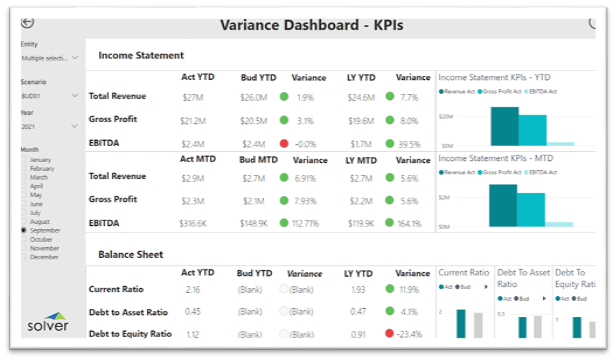
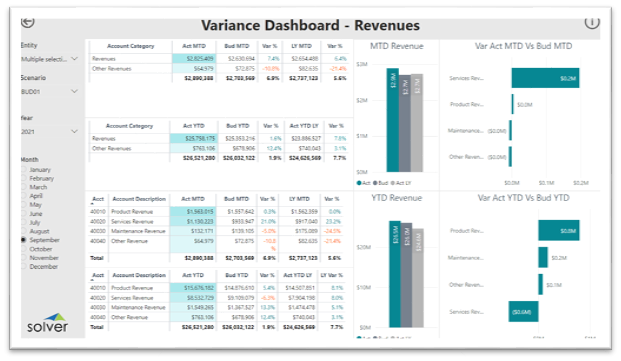
Putting It into Action
With the data structured for reporting and available for Power BI, your team can build dashboards using Power BI. Look at these examples of Power BI dashboards based on data from Solver. These dashboards are available as part of the Solver QuickStart method. QuickStart is a methodology companies can use to get data integrated and reporting, planning, and Power BI templates downloaded in a day.
What Next?
If your organization wants to use Power BI for creating dashboards, you have options. You can export data, use CData connectors, or use the Solver DW. Visit Business Technology Solutions for more information. If you have questions or need assistance, please reach out to one of our Sage Intacct and Solver consultants at FORVIS or fill out the Contact Us form below.