

Supply chain risk is a key risk facing Fortune 500, middle-market, and small businesses. In most cases, it ultimately impacts the end consumer. The COVID-19 pandemic and ensuing policy reactions caused major aggregate-level supply shocks, including disruption to the supply chain primarily in Southeast Asia during the pandemic’s onset. Lockdowns led to factory shutdowns, which caused severe reductions in supply production impacting global trade.
The rapid increase in both producer and consumer prices can be partly attributed to the supply shocks faced during the pandemic’s early months. The Producer Price Index (PPI) for all commodities peaked at 22.69% year-on-year growth in November 2021 and the headline Consumer Price Index (CPI) at 9% in June 2022.1 The growth in prices for both groups has since decelerated due in part to a hawkish U.S. Federal Reserve whose primary objective is now taming inflation through rate increases and quantitative tightening. Prices are still elevated by any historical comparison as the supply chain has not yet fully recovered. By some experts’ judgment, the supply chain may not fully recover as recent and continuing global developments support a trend toward deglobalization and a re-engineering of the supply chain. Developments such as prior trade wars, the Russia/Ukraine war, the global central bank’s monetary policy response, and emerging ESG and sustainability initiatives all stand to impact the ongoing development of the “newly and ever-evolving” supply chain in many ways.
Market research is a critical step companies can take to broadly understand and summarize how larger forces affect the supply chain. As with the use of the Internet of Things (IOT), robotics, analytics, and artificial intelligence supply chain technologies for firm-level deployment, companies also must deploy their resources to connect their firm to the broader economy by collecting and analyzing global and domestic aggregate supply chain data. This activity possesses several benefits such as helping to 1) make supply leaders and executives more data-informed when making key decisions, 2) connect company-level financials relative to broader economic trends, and 3) enhance underlying forecast assumptions.
One way to get started is to look at high-level indicators constructed and published by reputable sources and then break down what the indicator is summarizing. By understanding the current state, supply leaders will be more informed on the business decisions that can help propel their companies to a competitive future state.
What Is the Current State of the Supply Chain?
A lesson learned for businesses was that negative supply shocks in the form of lockdowns and production shutdowns cause severe constraints and backups in the supply chain. Considering the multitude of macroeconomic forces affecting the supply chain, one can use a single measure from the New York Fed, the Global Supply Chain Pressure Index (GSCPI), to gauge the overall status of global supply chain.
The GSCPI is a composite index comprising several indicators that are designed to quantify the extent to which there are pressures building in the supply chain. The GSCPI is relatively new and was created during the pandemic due to the need for a global measure of supply chain pressures. The New York Fed found that while some measures were being used as a proxy, they were being used in isolation, and no single indicator contained both global and domestic aspects of the supply chain.2 The New York Fed classifies the indicators used to construct the index into two categories: cross-border transportation costs and manufacturing industry data. Table 1 shows a summary of the indicators used and a description of what they are measuring:
Table 1: Summary of Indicators Used in the GSCPI (Source: NY Fed)
| Category | Indicator | Description |
|---|---|---|
| Cross-Border Transportation Costs | Baltic Dry Index | Tracks the cost of shipping raw materials such as coal or steel |
| Harpex Index | Tracks the container shipping rate changes for all eight classes of containers | |
| BLS Air Freight Price Indices | Measures the cost of air transportation freight to and from the U.S. | |
| Manufacturing Industry Data | PMI Delivery Time | Measures the change in supplier delivery times of purchase managers |
| PMI Backlogs | Measures the change in backlog of orders of purchase managers | |
| PMI Purchased Stock | Measures the change in inventories of purchase managers |
The New York Fed focuses the collection of manufacturing category indicators across the following seven regions and countries due to their economies and supply chains being highly interconnected: euro area, China, Japan, South Korea, Taiwan, the U.K., and the United States. Statistical analysis is then applied to the indicators and the resulting index is constructed starting in 1997 and published on a monthly cadence where values of the index are normalized to zero and reported as standard deviations from the average index value. Deviations from the average index value allow the reader to view the index as a volatility measure and, thus, gives insight into how quickly supply chain pressures are either increasing or decreasing. Chart 1 shows the GSCPI since 1998.
Chart 1: The Global Supply Chain Pressure Index (GSCPI)
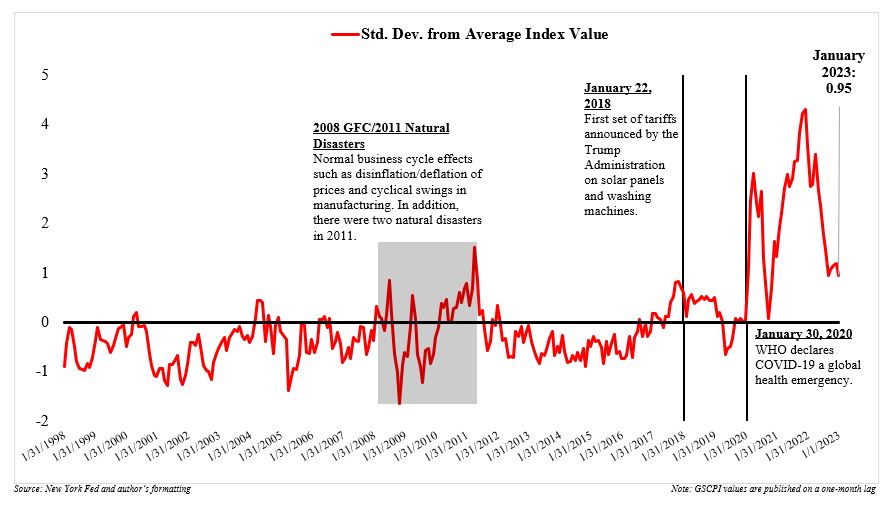
Upon visual inspection of the index and brief recollection back to the 2008 Great Financial Crisis (GFC), the index experienced cyclical swings due to normal business cycle effects such as disinflation and/or deflation of prices, as well as declines in manufacturing activity such as new order and backlogs. In 2011, there were two natural disasters in the East (Japan and Southeast Asia) that impacted production and ultimately global supply.
Fast forward to the 2017–2018 period, and we can see that the index value trended below its average for quite some time until the trade war between the U.S. and China where tariffs were placed on a variety of imports from both countries. The first set of tariffs came from the U.S. on solar panels and washing machines in January 2018, although it could be argued rhetoric of a trade war happened in the months prior. The index experienced slight variation and a decline before a sharp increase due to the COVID-19 pandemic. The initial lockdowns in China in early 2020 caused a severe drop in the productivity of Chinese manufacturers and backups in the rest of the supply chain. The index peaked in December 2021 and has since come back down, suggesting the supply chain is on its path to moderating although still elevated by historical comparison. The most current reading in January 2023 was 0.94, down from 1.19 in December.
Analysis from the New York Fed suggests that the recent developments in Asia have contributed to a pause in the moderation of the index back to more normal levels.3 Specifically, January estimates suggest the largest contributing factors were Korean delivery times, Chinese delivery times, and euro area backlogs.4 While the GSCPI is a broad measure of the supply chain, the thought exercise of breaking down provides insight into more specific indicators that are influential within the supply chain itself. Supply chain indicators also are correlated with the recent inflationary pressures we’re seeing in the producer and consumer price indexes. Producer prices are important because they represent prices paid by businesses within the different stages of production/manufacturing: the manufacturer, the distributor, the wholesaler, and the retailer. Consumer prices are those paid by consumers once they hit the shelves at the retail point of sale.
Large increases in producer prices can lead to suppliers marking up their prices for buyers downstream, which is often referred to as “cost-push” inflation. Surges in prices also can come from consumers themselves in the form of excess aggregate demand, referred to as “demand-pull” inflation. We’ve seen both forms of inflation during the most recent bout of supply chain pressures and the pandemic in general.
Prices & the Supply Chain
For many businesses, the pricing of inputs is the single largest factor for having a well-functioning and defined supply chain system. Understanding the variability of your input costs relative to the market and how that impacts your demand planning, forecasting, and financial planning and analysis processes are important; in recent months, variability can show up in the form of a manufacturer still incorrectly using standard cost estimates while operating in the current inflationary environment. This is important for the overall demand planning and forecasting processes because incorrect assumptions underlying the projections can lead to misleading forecasts and budgets on the future state of the business.
Take, for instance, a manufacturer who incorrectly uses standard cost estimates. In this example, the manufacturer had relied on estimates of what it “theoretically” should cost to make the product based on past experience and other reasonable factors. A global pandemic was a very low probability event prior to COVID-19 and would not have been generally reflected in business leaders’ underlying assumptions about external risks to manufacturing and other highly coordinated supply chain operations. Once the pandemic had made its way through the supply chain (by disruption), there was significant uncertainty regarding the disruptions and what that meant for prices in both the short- and mid-term. In addition to the disrupted supply chain, the U.S. government injected fiscal stimulus that was supported by the Federal Reserve’s monetary policy actions. When forecasting future cost of goods sold in your operational budgets (production, direct materials, direct labor, and overhead), it’s important to set realistic assumptions regarding monthly, quarterly, and annual increases in your input prices due to both normal and abnormal market activity.
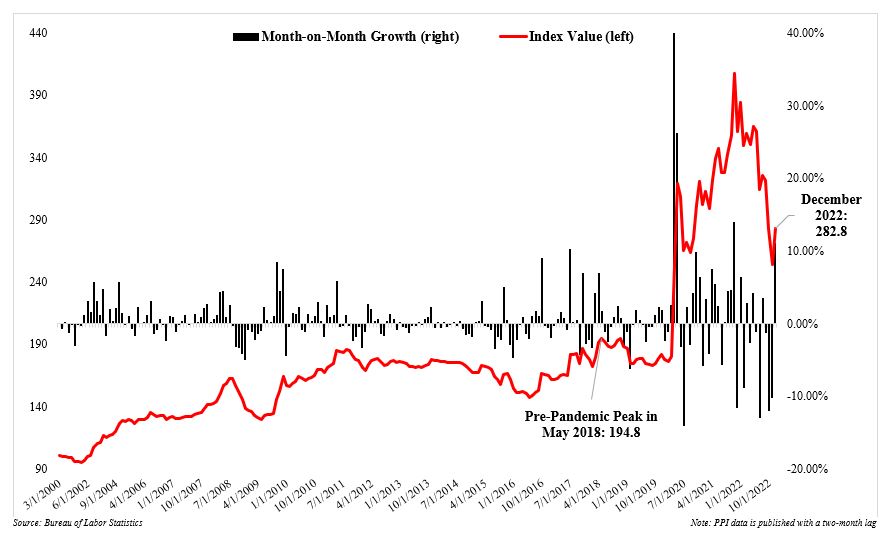
A simple way to periodically check that you’re forecasting your input transportation costs appropriately is to benchmark them with the broader market and use the most recent period(s) price increases as the most likely outcome for the next period(s). If we continue using the GSCPI as a reference, we see a completely different picture regarding a part of the supply chain when we look at import air freight prices alone. Chart 2 shows the BLS monthly import price index for air freight and the month-on-month growth of the index. The monthly import price index for air freight costs measures the prices paid for shipping to the U.S. from both Europe and Asia. The notable spike in April 2020 in both the index and monthly growth were due to the COVID-19 pandemic and lockdowns that followed as the production and transportation of goods slowed substantially.
One can see that in addition to the GSCPI (Chart 1) peaking and since moderating, the growth in air freight costs has decelerated three straight months since September 2022 with only a recent uptick of +11% in December, signaling there may be some cyclicality left to filter out in producer prices as we progress beyond the pandemic. Although both the aggregate GSCPI and underlying import air freight cost indexes appear to be correlated in the short term, business leaders should not lose sight that import air freight costs in the supply chain are still 45% higher than their previous pre-COVID peak in May 2018 (May 2018 – 194.8 versus December 2022 – 282.8).
Chart 2: Monthly Import Price Index for Balance of Payments: Air Freight
Whether you start with an aggregate level indicator or go straight to the individual data series relevant for your company, market research and benchmarking your financial figures to what the market/economy has recently done and is currently doing provides beneficial insight for supply leaders and company executives. With the new chapter of supply chain management rapidly developing, failure to use and embrace the capabilities of big data and any corresponding analysis could be detrimental to a company’s long-term growth as it continues to operate through a “micro-sphere” lens without awareness of the broader economy.
How We Can Help
Our advisory team at FORVIS can help support the enhancement of your supply chain operations. If you have any questions or need assistance, please reach out to a professional at FORVIS or submit a Contact Us form.
- 1U.S. Bureau of Labor Statistics (BLS)
- 2“A New Barometer of Global Supply Chain Pressures,” Liberty Street Economics, libertystreeteconomics.newyorkfed.org, January 4, 2022
- 3“Global Supply Chain Pressure Index: The China Factor,” Liberty Street Economics, libertystreeteconomics.newyorkfed.org, January 6, 2023
- 4 https://www.newyorkfed.org/research/policy/gscpi#/interactive