

FORVIS’ 2023 Rural Telecommunications Benchmark Study (Study) is complete and—when combined with previous Studies and the Telergee Telecommunications Benchmark Studies—has 22 years of valuable financial and operational information for the rural telecommunications industry.
Download the full report below
The Study answers two main questions:
- How is the telecommunications industry performing financially?
- How is my company’s financial performance compared to my peers?
In 2023, 167 rural telecommunications companies in 19 states participated in the Study. It provides benchmark results for the 2022 balance sheet and income statement and more than 37 other key metrics.
Each year the Study provides an in-depth look at how the rural telecommunications industry has performed. This year we take a deeper dive into the impact of inflation, broadband services, and broadband grant programs.
Impact of Inflation & Increasing Costs
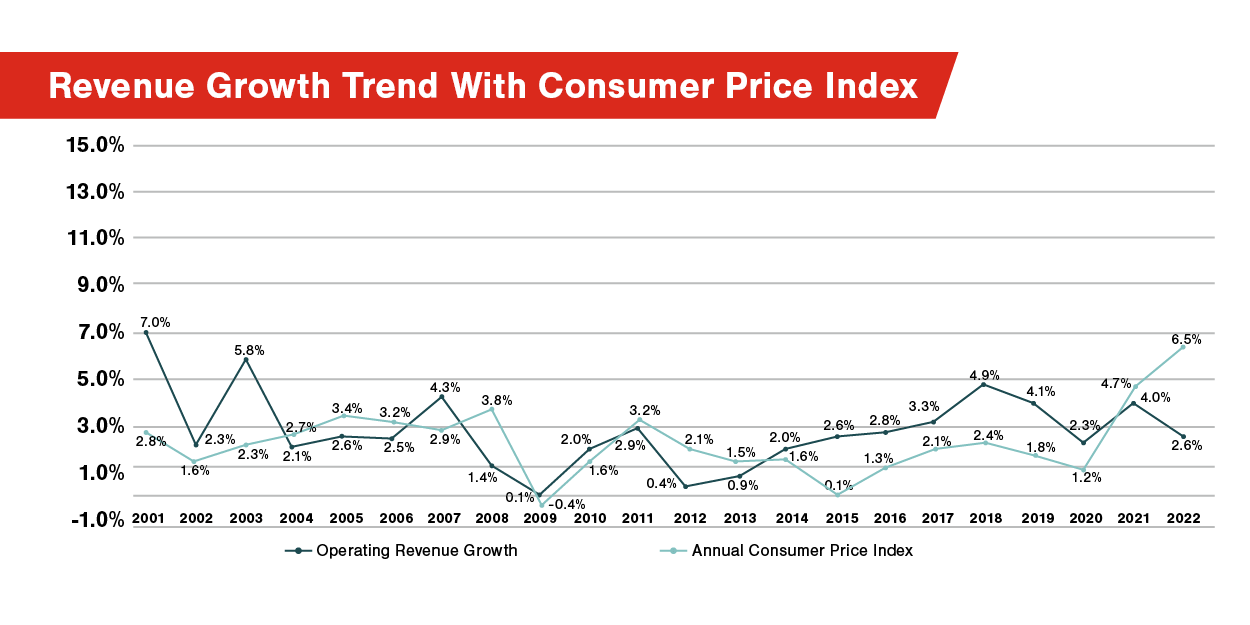
The 2023 Study calculates the percentage increase in operating expenses both with and without depreciation expense. Total operating expenses increased 5.1% in 2022 and without including depreciation expense, operating expenses increased 5.2%. The increase in operating expenses is almost double the 2022 2.6% increase in total operating revenues. As the graph indicates below, the increase in operating expenses is slightly under the 6.5% rate of inflation as calculated using the annual Consumer Price Index (CPI). The graph provides a historical perspective of total operating revenue growth for the industry compared to inflation measured by the change in CPI.
Broadband Grant Programs
In 2022, 85 participating companies accepted $600 million in federal, state, and local government broadband grants compared to 69 companies accepting $336 million for 2021. There was a 23% increase in companies and a 79% increase in broadband grant awards over amounts awarded during 2021. These grant programs include state-administered broadband grant programs utilizing state funds, state-apportioned federal CARES Act funds, and American Rescue Plan Act funds, along with federal broadband grant programs administered by the National Telecommunications and Information Administration and Rural Utilities Service.
Through 2023, the average (median) broadband grant awarded was $2.7 million with 19 companies (11 in 2022) reporting total grants of more than $10 million each.
Broadband Rating
Last year the Study introduced a broadband rating for each company participant, which included the following three financial metrics:
- Operating income as a percentage of network access revenues
- Broadband internet revenue growth
- Operating income growth
The goal of the broadband rating is to focus on revenue growth while including a factor to account for dependency on network access revenues. A higher broadband rating is better, which indicates revenue growth and lower dependency on network access revenues.
Broadband Rating Results for 2023
Third Quartile = 88.5
Median = 45.3
First Quartile = 4.4
Did company size make a difference in the broadband rating? The following graph includes the Study results based on revenue size for both 2022 and 2021. The rating was down for all revenue groups due to the decline in operating income as a percentage of revenue growth and slower growth of broadband internet revenues in 2022.
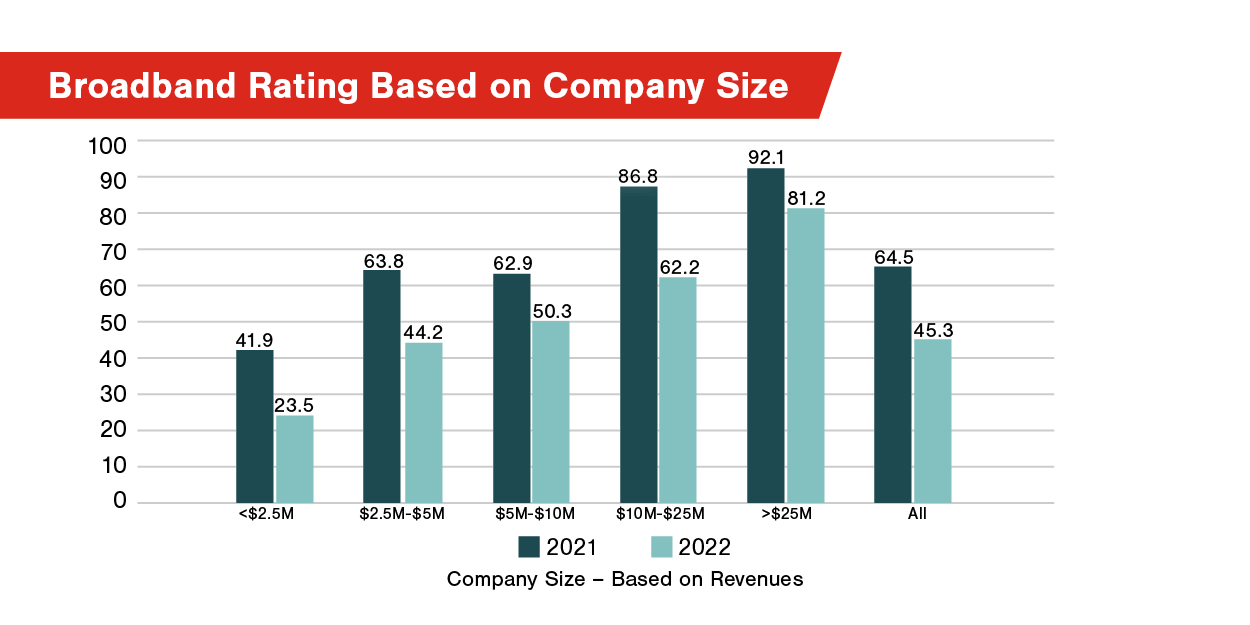
Why did large companies (based on revenues) have a higher rating? Calculations for the largest group (exceeding $25 million) reveal their higher rating was driven by less dependency on network access revenues (as expected) and a higher growth rate of broadband internet revenues. As with all benchmark metrics, including the broadband rating, it is important to compare your company to appropriate peer groups. The following graph presents the broadband rating for the last six years.
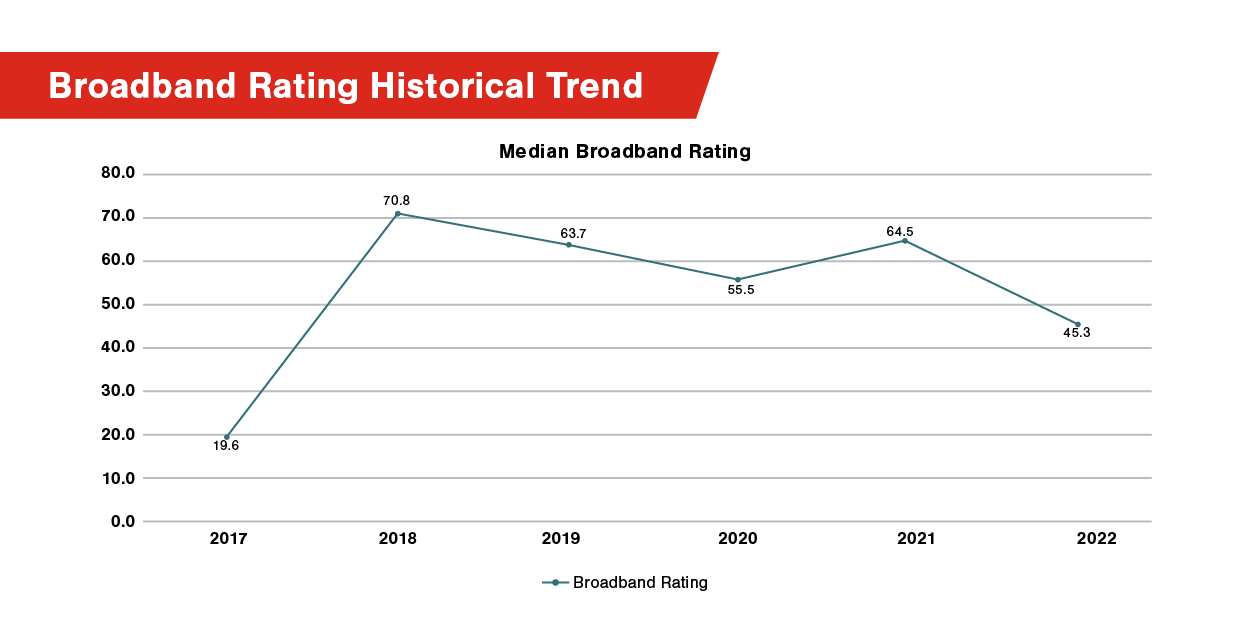
2017’s lower broadband rating is because of poor performance in two out of three rating metrics. The average company in the Study had a negative operating income growth rate and a broadband revenue growth rate of only 9%. These metrics improved in 2018.
Broadband Services Impact on Financial Results
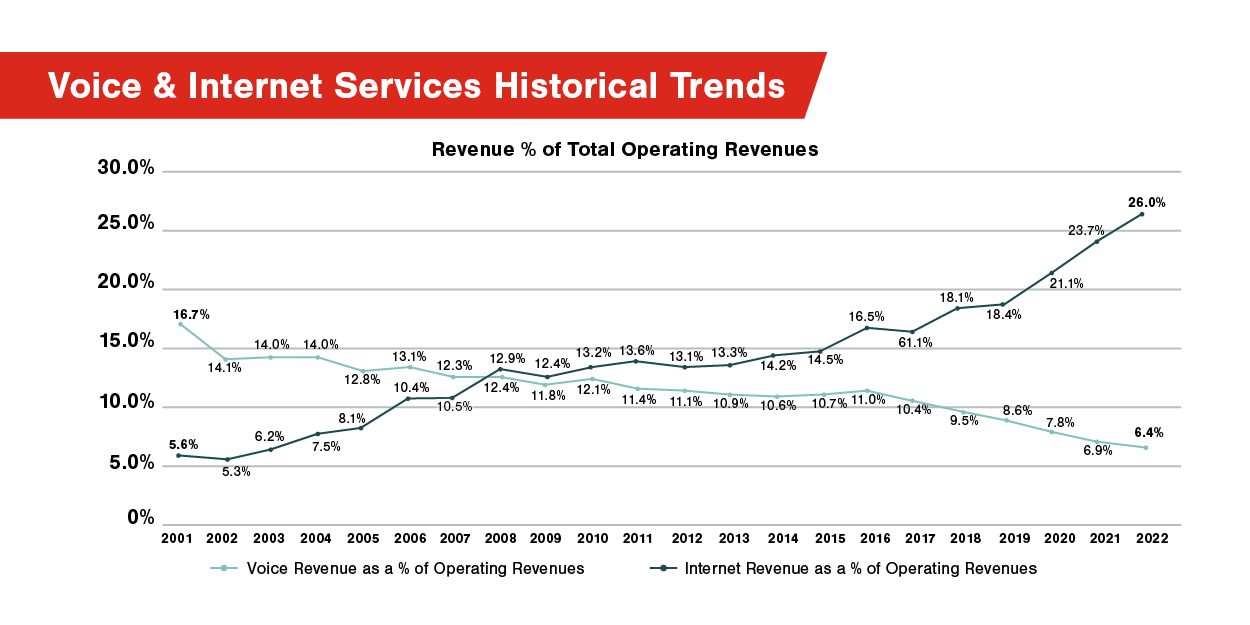
The increase in access to broadband services over the past 22 years has resulted in increased broadband revenues. The following graph demonstrates the growth in broadband revenues and the decline in voice service revenues during this time period. Broadband revenues are the second largest source of revenue, just behind network access revenues.
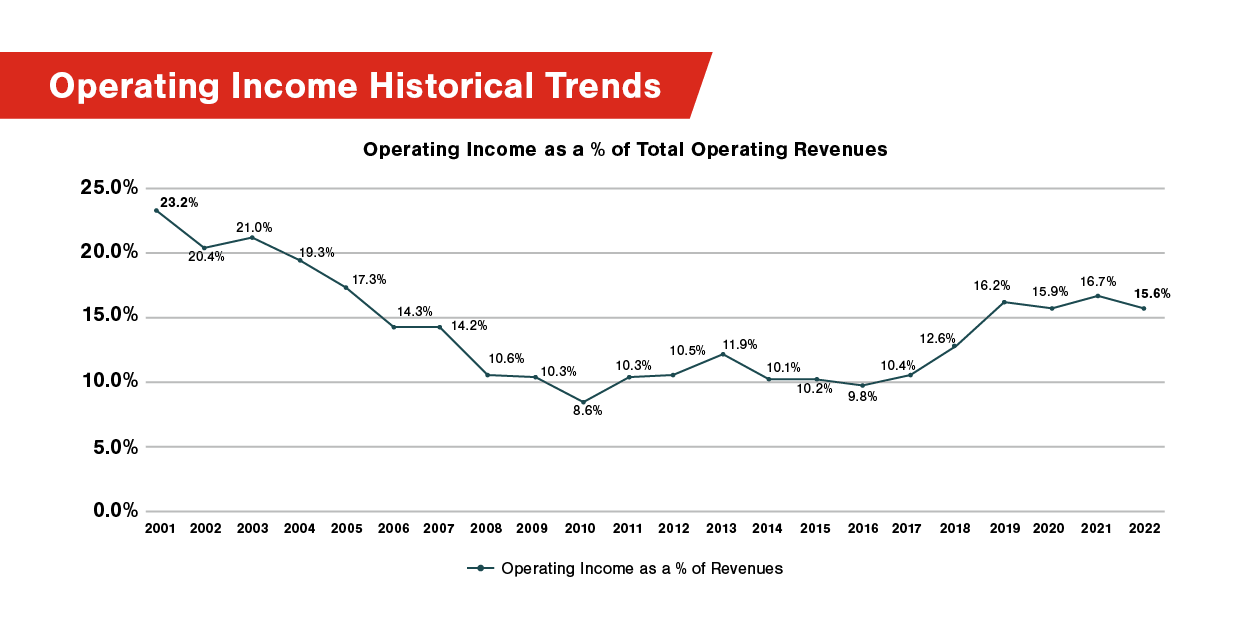
While broadband revenues have increased significantly over the past 22 years, operating margins have not. The following graph indicates that operating margins have rebounded since the lows of 2010 but are still not near the peak of the early 2000s.
Available Peer Groups
- Commercial/Cooperatives
- Rate of Return/ACAM I/ACAM II
- Revenues (Five Groups)
- Access Lines/Connections (Five Groups)
- Companies With Debt & Without Debt
- Companies With Grants & Without Grants – New in 2023
- Geographical Regions (Midwest, Iowa, & Great Plains)
- Investment Income (Less Than & More Than $1 Million)
- Employees (Six Groups)
- All Companies
This is the sixth year the Study has been published, and throughout the six years we have made enhancements and changes improving the metrics significantly, including the ability for the participating companies to benchmark the five-year trend of key metrics. With a significant number of rural telecommunications companies receiving broadband grants, we added peer groups for companies with broadband grants and without broadband grants. As mentioned above, of the 167 participating companies, 85 companies have accepted broadband grants through May 2023. We also added peer groups for companies with long-term debt (96 companies) and companies without long-term debt (71 companies). That represents an increase of five participating companies with long-term debt as compared to the 2022 Study.
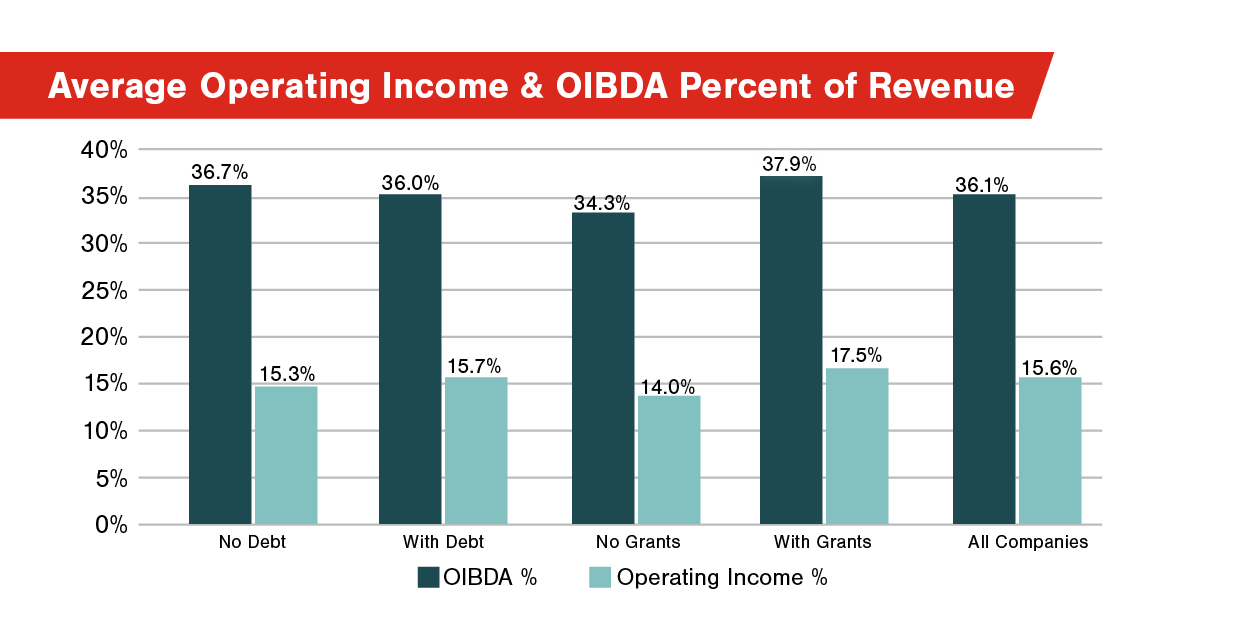
The following graph provides the operating income before depreciation and amortization (OIBDA) and operating income percentages of total operating revenues.
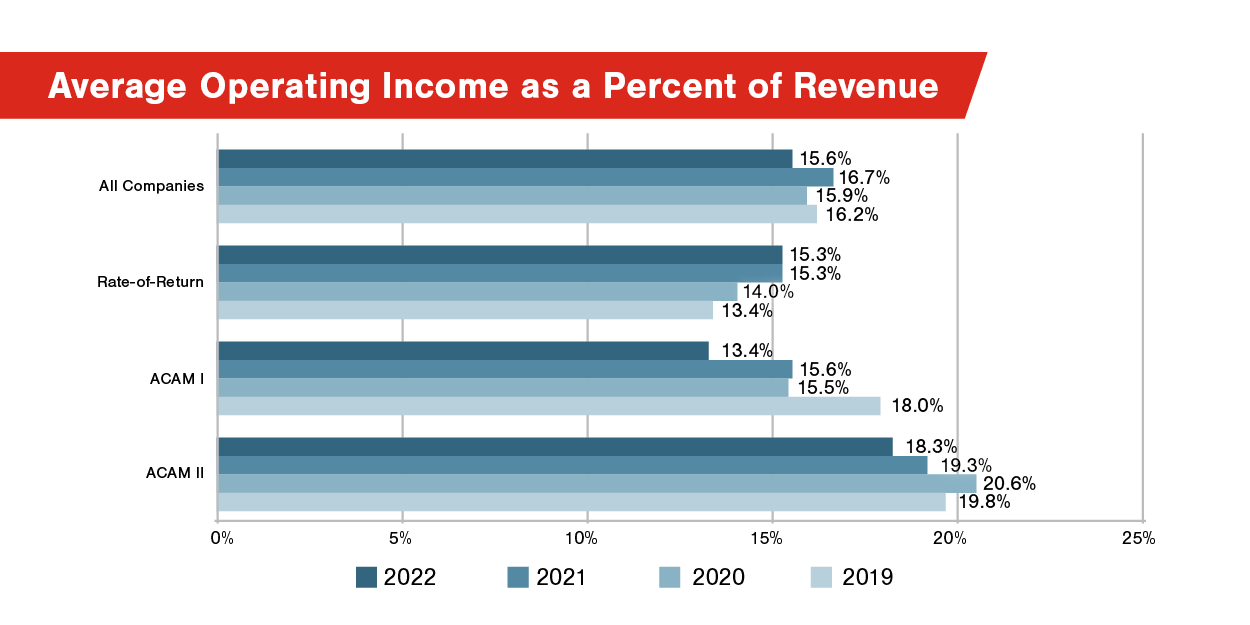
Of the 167 companies in the Study, 94 have elected either ACAM I (48 companies) or ACAM II (46 companies) as their form of regulation. The graph below demonstrates—at least early on—that companies electing ACAM had higher operating income as a percentage of revenues than legacy rate-of-return carriers. While rate-of-return companies had lagged the ACAM companies, it is interesting to note that the ACAM I companies’ 2022 operating income as a percentage of revenues is less than the legacy rate-of-return carriers.
2023 Key Benchmark Results Based on Revenue Peer Groups
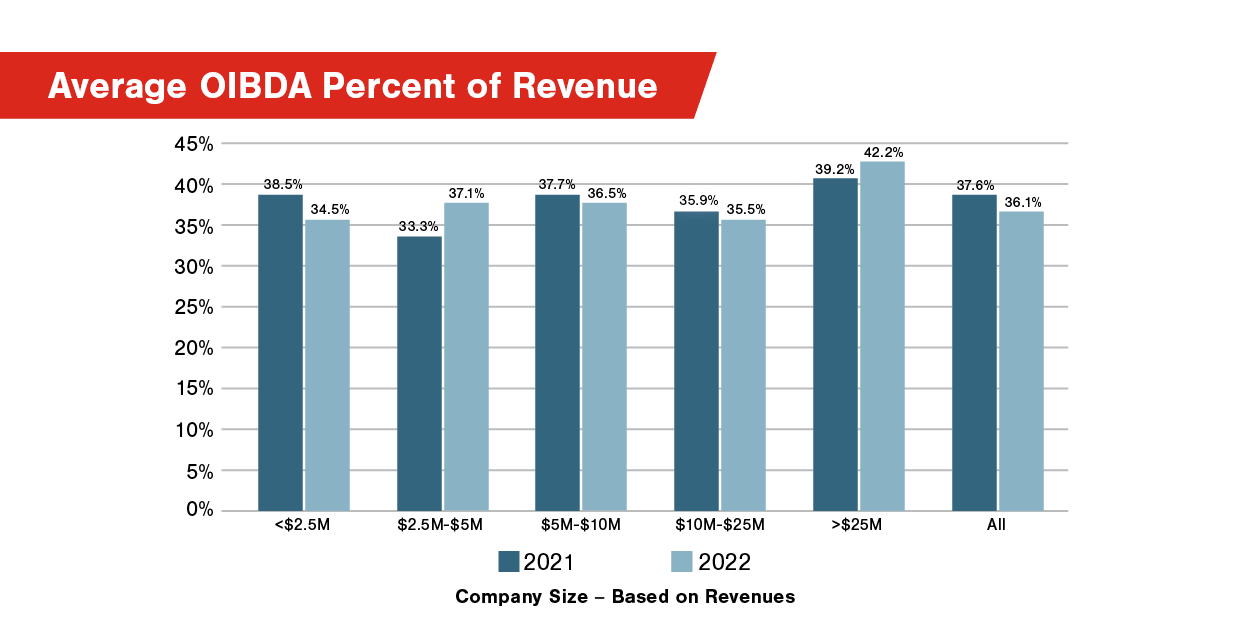
OIBDA is an important financial metric to measure growth in cash flows and total leverage ratios. The graph below indicates that OIBDA decreased in 2022 for all revenue peer groups except the midsize ($2.5 million–$5 million) and the largest (greater than $25 million).
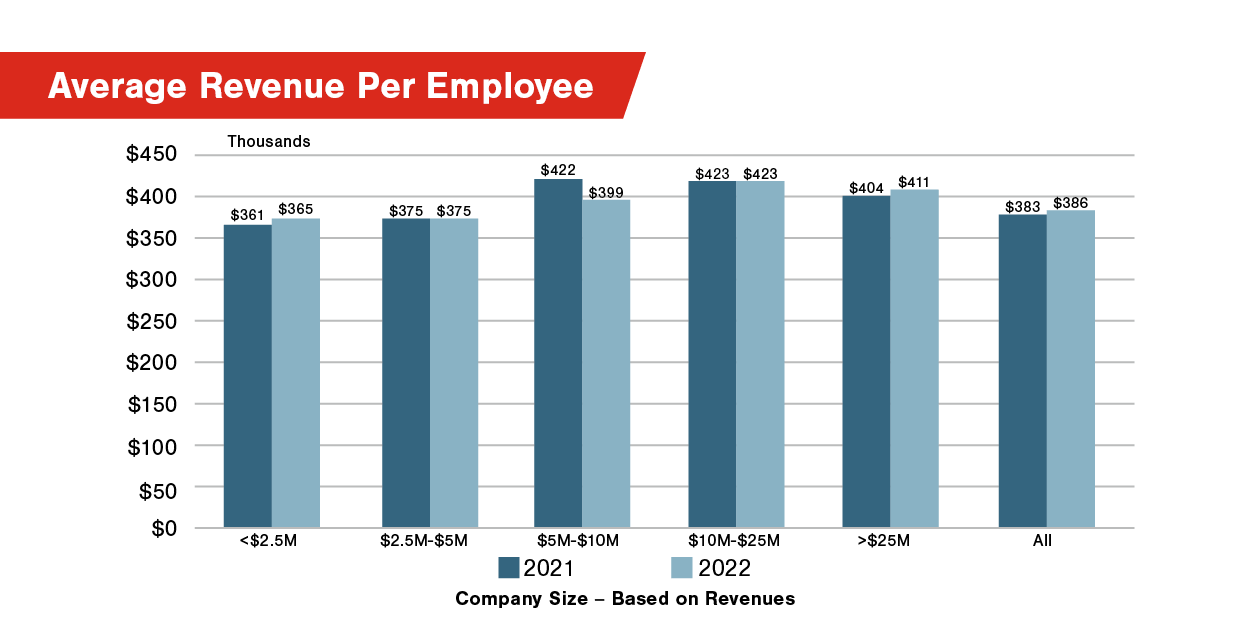
Revenue per employee assists in determining whether a company is overstaffed or understaffed. The graph below indicates a relatively small deviation between companies based on revenues.
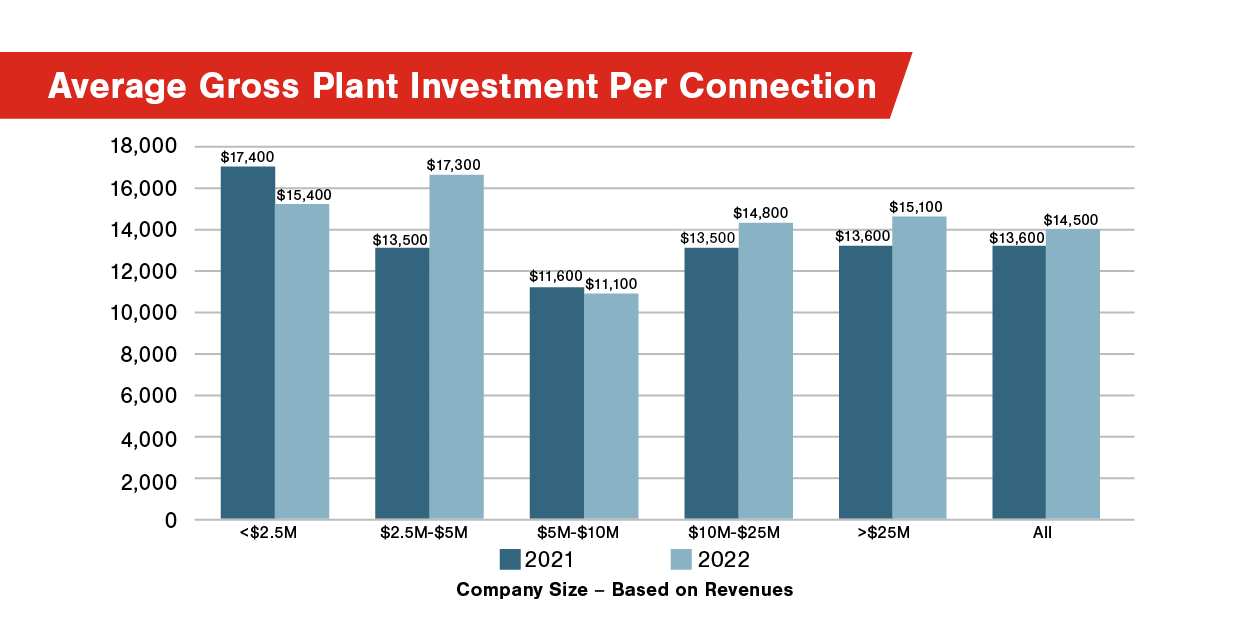
One of the biggest effects on profitability is the investments necessary to provide services to customers. The 2022 average gross plant invested per connection below is higher (except for the smallest revenue peer group) than the results in 2021.
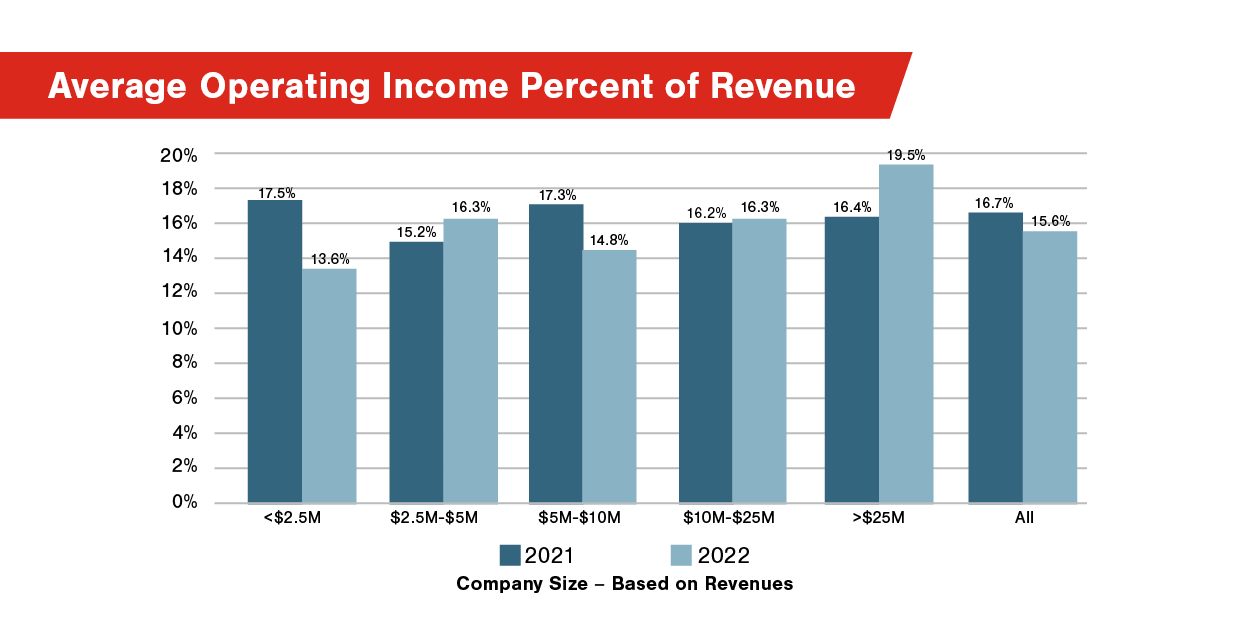
The average operating income percentage measure demonstrates how much of the company’s revenues ultimately get to the bottom line. Growth in revenues needs to provide for growth of operating income. It was disappointing to see an overall decrease in operating income in 2022 as a percentage of revenues while not unexpected with the increase in expenses experienced in 2022.
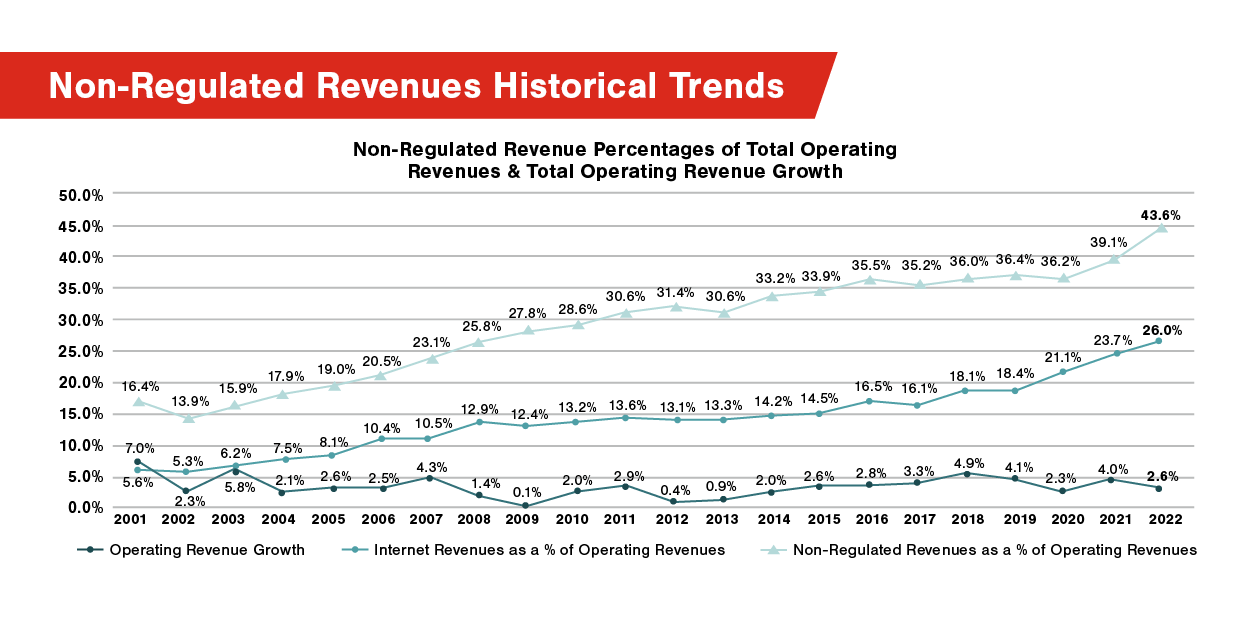
Trends are important, whether it’s your company’s performance or the industry as a whole. The graph below provides a historical trend in total operating revenue yearly growth, internet revenues as a percentage of total operating revenue, and non-regulated revenues (including internet revenues) as a percentage of total operating revenues based on the Study for the industry over the last 22 years. While non-regulated revenues, including internet revenues, have become a bigger percentage of total revenues overall, total revenues have only shown modest growth over the past 22 years. It has been almost 20 years since total operating revenues grew by more than 5%. It will be interesting in this current environment of high inflation and higher interest rates whether rural telecommunications companies will see future significant growth in total operating revenues.
These are just a few of the key benchmarks available in FORVIS’ Rural Telecommunications Benchmark Study, available for download below.
If you participated in the Study, you will receive your company’s results. If you want to participate or learn more about the Study and how it can benefit your company, please reach out to a professional at FORVIS.
If you participated in the Study, you will receive your company’s results. If you want to participate or learn more about the Study and how it can benefit your company, please reach out to a professional at FORVIS.