

Reports that list the top N records are quite popular. Power BI has that functionality built into a filter for its visualizations. Creating a report in Solver that lists the top N records also is based on a filter. In this article, we’ll show how to create a top N report in Solver in a few simple steps.
As an example, let’s go through creating a “Top 5 Customer Report” based on revenues in a period. The report will list the customers and the amount of revenue. The data will be sorted by the amount of revenue based on the period selected.
Here’s how to do it.
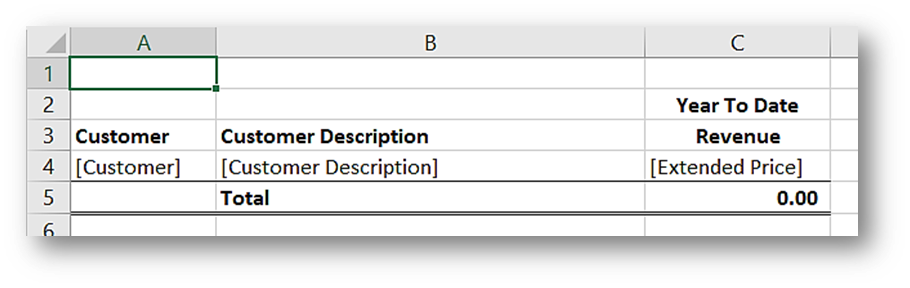
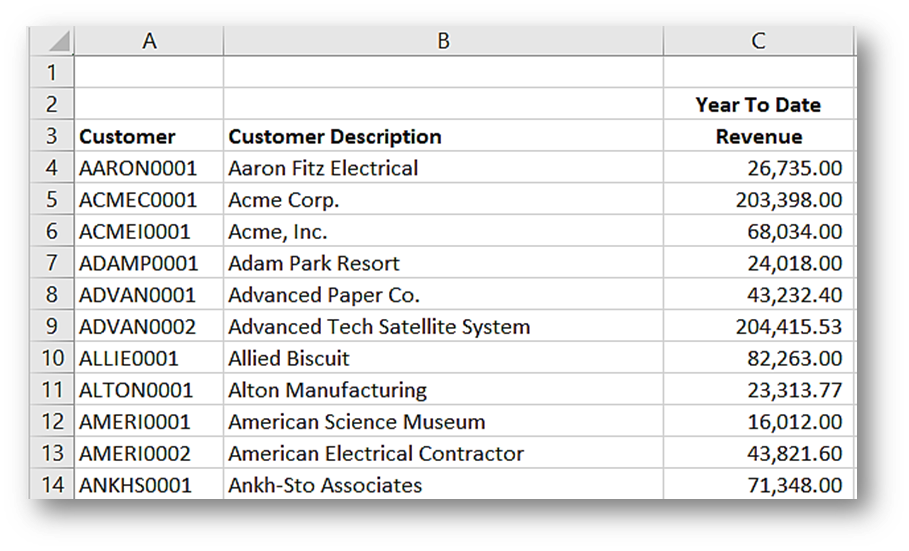
Create the report as you normally would. Below are screenshots showing the report design and result without the top N filter.
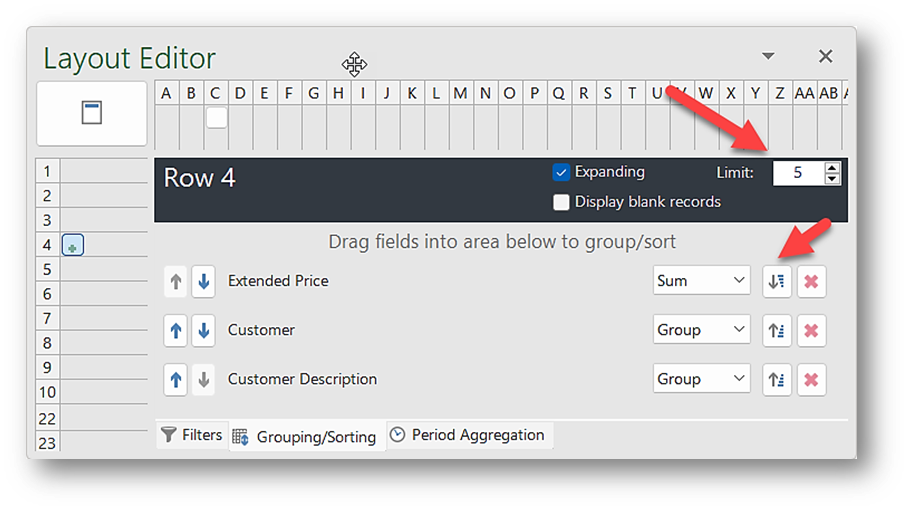
Adding the filter for the top N report requires two steps:
- Add a grouping for Extended Price (the amount shown in the Revenue column).
- Select the number of records to display.
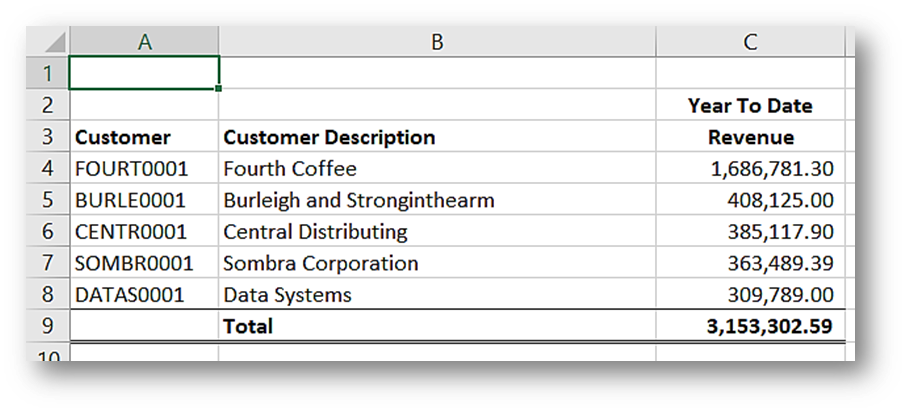
Here’s how the report looks with the new filters.
There you have it! Now you know how to create a top N report in Solver in just a few simple steps.
How FORVIS Can Help
The Business Technology Solutions team at FORVIS has certified experience with Solver and various enterprise resource planning (ERP) technologies. We are a Microsoft Dynamics Gold Partner and recipient of the Solver Evangelist of the Year award. Use the Contact Us form below to ask questions or learn more about reporting and ERP technologies.