

When it comes to reporting and planning, companies need flexibility and the ability to do things quickly and easily. This article examines how Solver’s corporate performance management tools can help bring agility to reporting and planning in Microsoft Dynamics 365 Business Central.
Financial Reporting
Business Central
For reporting, many companies think about monthly financials first. There’s a lot of information in those financial reports and they can provide a lot of insight into the company. The stakeholders who rely on the report information expect the preparers to produce it on a timely basis. There’s also that occasional need to create a new report on the fly due to a stakeholder request.
For many companies, though, it’s not a matter of producing a single set of the trilogy of reports: profit and loss (P&L), balance sheet, and statement of cash flows. Many companies have several versions of each report. Those versions serve different purposes and audiences.
How are these reports created in Business Central? Financial Reporting, previously known as Account Schedules, is the answer.
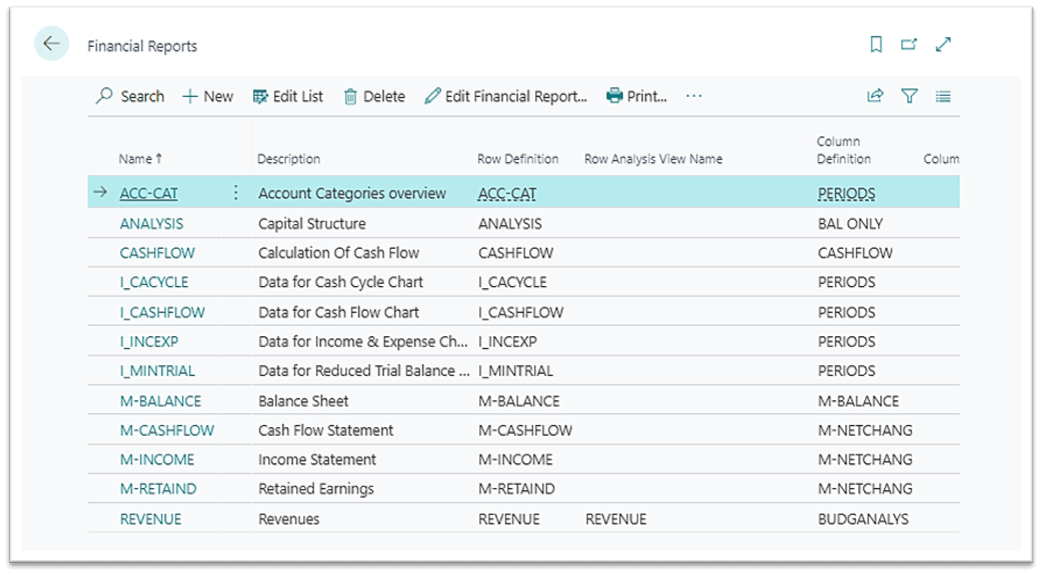
Figure 1 List of Financial Reports in Business Central
If you’ve created one, you know the ingredients that go into it:
- Format the chart of accounts with headers, totals, categories, and subcategories
- Create row definitions
- Create column definitions
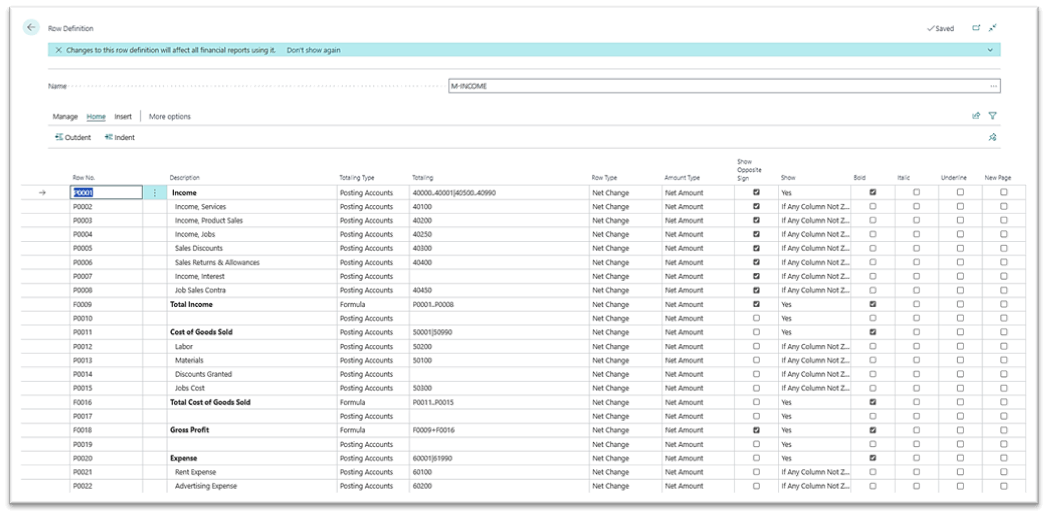
Figure 2 Example of a Row Definition in Business Central
These reports can be printed and exported to Excel. For formatting, some organizations export the reports to Excel and apply formatting changes. However, there can be some challenges in Financial Reporting that you may want to overcome.
Here are some issues you may encounter:
- Formatted reports
- Dimensional reporting
- Consolidated reporting
- Different account groupings
- Drill downs to transaction details
- Report distribution
For help with these issues in Financial Reporting, read on.
Solver
The Solver corporate performance management solution is a Microsoft Azure-based tool that includes reporting and planning, as well as connectors for multiple business management systems, like Business Central, and connectors for Power BI and Tableau. It provides reporting for all modules in Business Central so users can have a single reporting solution across the organization. In addition, while you can store budget data in Business Central, you can create input templates in Solver for users to enter budget and forecast data to help streamline the process.
Getting started can be quick and easy with the QuickStart wizard. The QuickStart wizard walks through importing Business Central data into the Solver data warehouse.
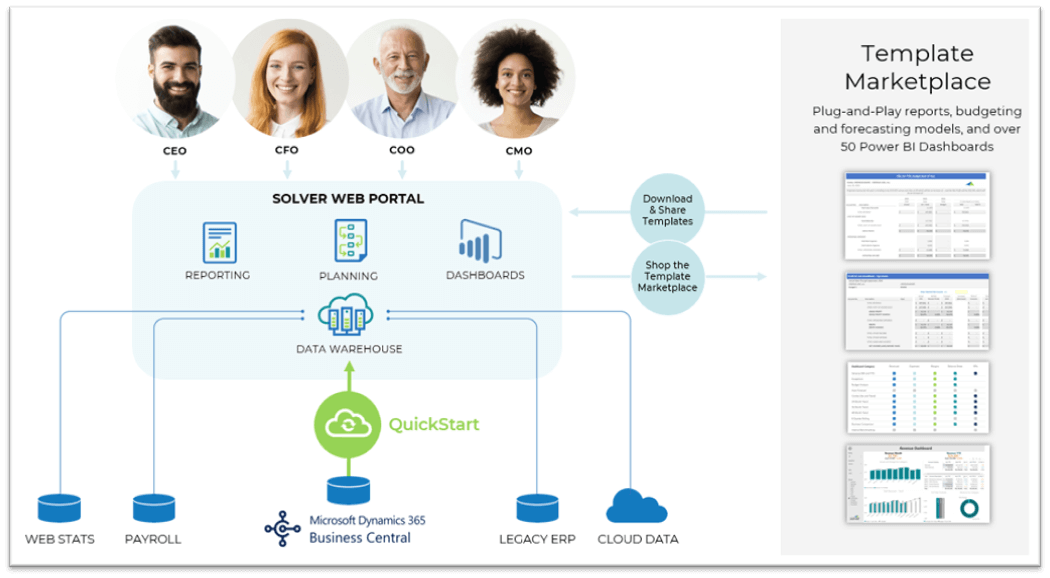
Figure 3 Solver Architecture
Reports in Solver are created in Excel and run in the cloud. Users can log into Solver from anywhere and run reports with drill-down and export functionality. Users also can comment on report results and share them with others.
The following image shows an example of a report in the cloud. There are multiple things to notice:
- It looks like an Excel spreadsheet. It looks that way because it is! Reports are created using Excel with a Solver add-in.
- Drill-down functionality is included, although you can create your own drill-to definitions.
- Reports can be exported to PDF and Excel.
- Reports can include formatting and be ready for printing without exporting to Excel first.
- Trees can be used to roll up business units and report them in summary and detail, as shown by the individual sheets in the image.
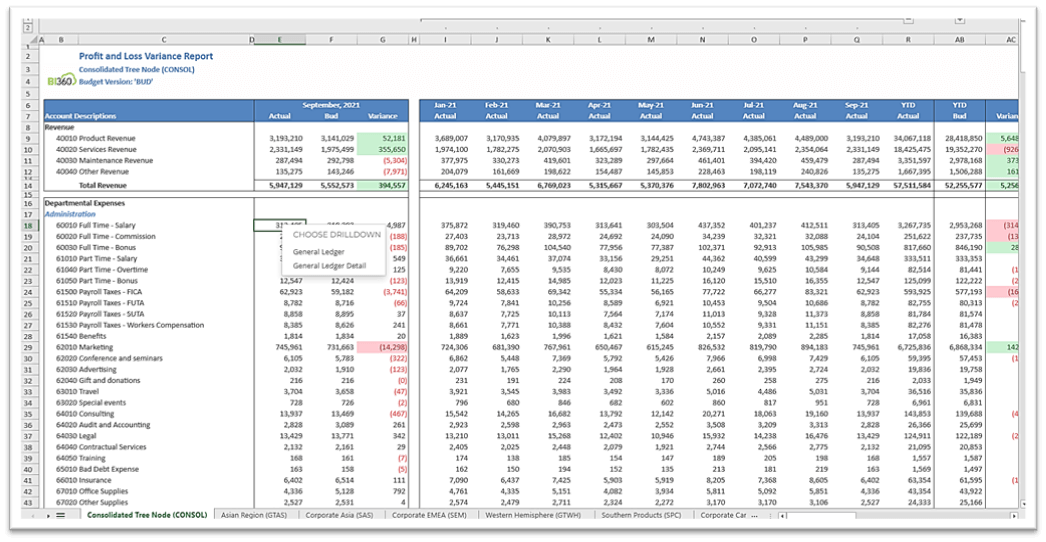
Figure 4 Solver Report in the Cloud
Report Design in Solver
Creating reports in Solver is like creating pivot tables in Excel. With pivot tables, you drag and drop fields to the areas where you want to see them. With Solver reports, you drag fields from the data into the report design.
Report designs in Solver can be much smaller in design than those in Financial Reporting. Using concepts such as groups and filters, you can define rows and columns to expand when you run the reports. These concepts can help you build report designs that are small but can expand into elaborate results.
The next image shows the report design for the results shown in Figure 4. Notice how few rows and columns there are in this report compared to the example shown above.
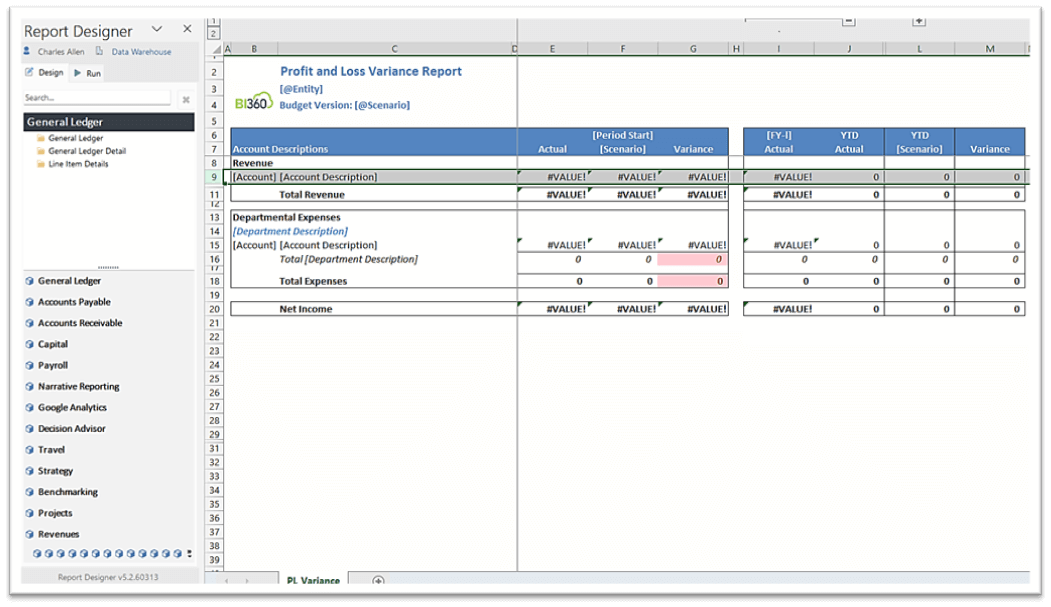
Figure 5 Report Design in Solver
The report uses groups and filters on rows and columns.
On the Revenue row, row 9, there’s a filter for a range of accounts. Filters can be set up for account ranges or other account attributes. For example, account category could be used.
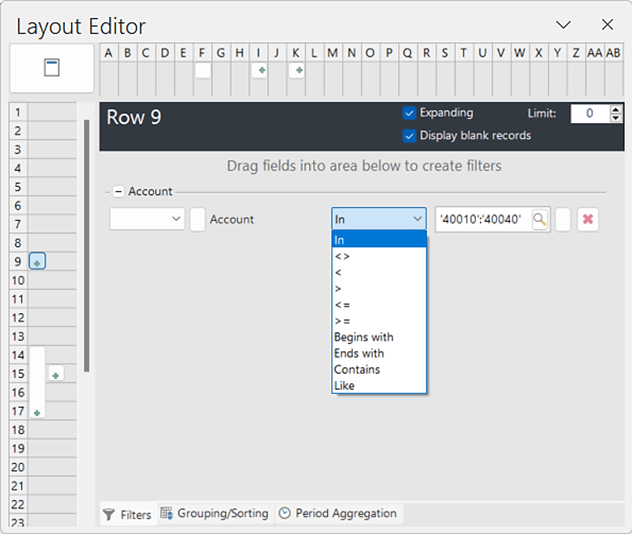
Figure 6 Examples of Filters
Groupings can be set to use any attribute, like account or category. As you add more fields to the grouping, the report will have more details. In that way, the report design process in Solver works like pivot tables.
In addition to using filters and groups, you can add parameters, which can be set for the user or left open for the user to enter. For example, you can let the user enter the department the report covers. Parameters, like everything else in Solver, follows the user’s permissions. Thus, if the user doesn’t have access to a department, the report will be blank for the user.
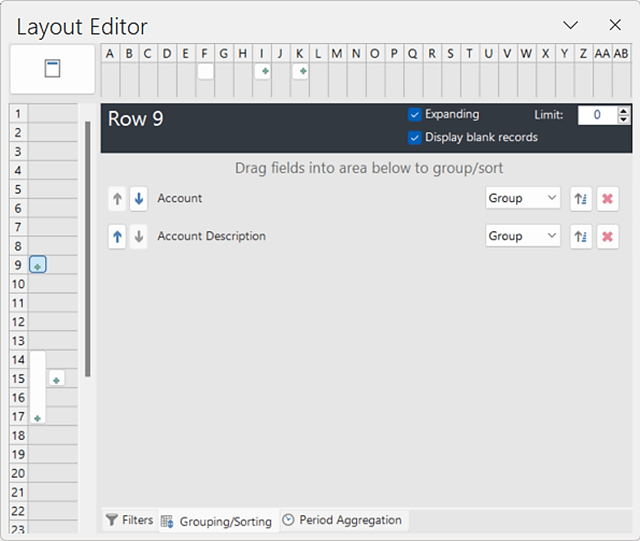
Figure 7 Examples of Grouping
Columns can use grouping, too. In the example shown here, you can have a single column expand into multiple columns with a different period shown for each column.
Beyond Financial Reporting
Business Central comes with many built-in reports and lists to help users get information from the system. You can scan, find, and limit records on a list or in a report by sorting, searching, and filtering. You also can create your own lists using Popdock by eOne Solutions.
In Solver, you can use the same report design experience to help create reports against other modules, like Sales. Once you learn how to create reports against one set of data, the knowledge can be used to create more reports for other data sets.
The next image shows a report showing Accounts Payables data. It uses Excel charts as well as expanding groups with the outer group being the vendor and the inner group being each invoice.
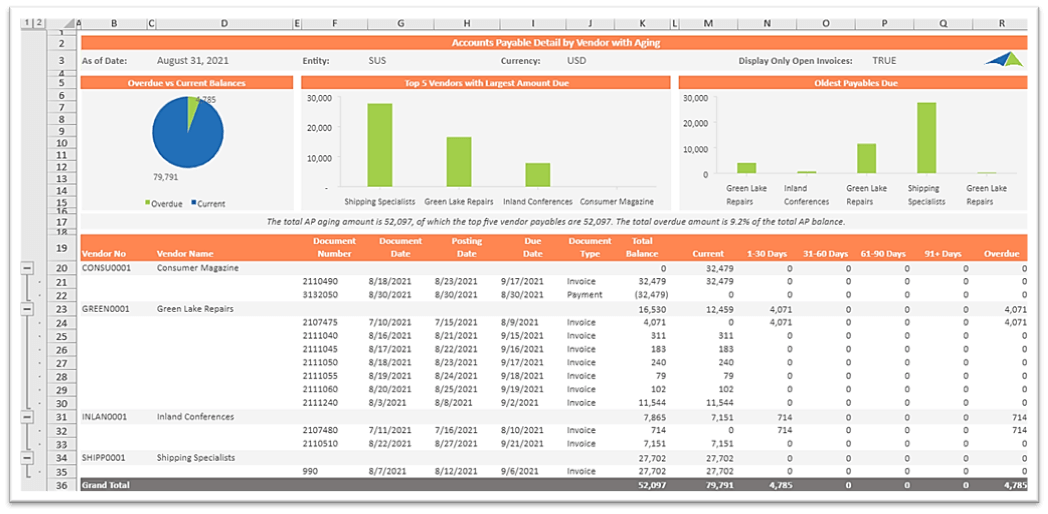
Figure 8 Example of Report for Accounts Payable
Just like with the financial reports, this report can be exported to Excel and PDF. Users also can drill down to find details. For example, if you loaded invoice details into Solver, the user could drill down from the invoice amount to the line-item details.
In addition to data stored in Business Central, users can create reports using data from other systems, like:
- Payroll
- Microsoft Dynamics 365 Sales
- Salesforce
- HubSpot
- Experlogix
- ExpandIT
Ad Hoc Reporting
There are times when you need data quickly and a formal report isn’t needed. In those cases, Solver’s Ad Hoc reporting functionality might be the answer. Ad Hoc reporting uses a Power BI-like interface to help users create reports that can be exported, saved, and shared. All data in the Solver data warehouse can be used for reports.
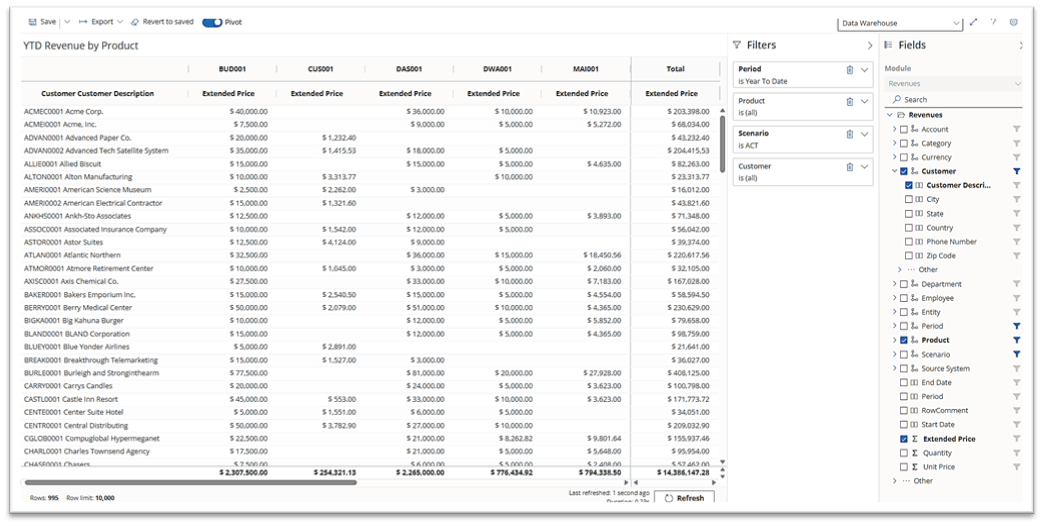
Figure 9 Ad Hoc Reporting
Conclusion
When using Business Central, users have multiple reporting options: Financial Reporting, Standard Reports, and Lists. Solver can help users create more reports with different designs using one tool. Using one tool can help reduce the learning curve, increase efficiency, and speed up reporting and planning processes. If your team members are spending more time compiling reports instead of using reports, your company may benefit from using Solver.
FORVIS and Solver Global, the publisher of Solver, have been partners for many years. FORVIS, an international accounting and consulting firm, is an award-winning partner of Solver Global, which itself is highly rated by G2, a leading software marketplace.
Learn more about Business Technology Solutions at FORVIS.