

Introduction
In the world of commercial lending, the prime lending rate has traditionally been reserved for borrowers deemed to have the best credit quality and lowest probability of default. Credits of lesser quality are normally charged a higher rate representing a spread over the prime rate.
The prime rate is typically 300 basis points (bps) over the federal funds target rate, although many institutions have their own bank-specific prime rate.
To battle inflation and reign in economic activity, the Federal Reserve has increased its target rate by 525 basis points over the last two years. The prime rate has followed the federal funds rate directly while the rest of the U.S. Treasury (UST) curve, representing market rates rather than managed rates, has also risen, but to a lesser degree.
Market rates reflect investors’ long-term inflation expectations and other market dynamics, which may or may not follow changes in managed rates. During the current market cycle, these underlying interest rate changes and the stiff competition between lenders, have resulted in many new loan rates being quoted at 100 bps or more below prime. Within this very challenging environment, two relevant questions emerge.
Prime Minus Lending
- Why are we seeing so much “prime minus” lending?
- How should lenders respond to these market forces stressing their margins?
Let’s first look at changes in the UST curve over the last few years.
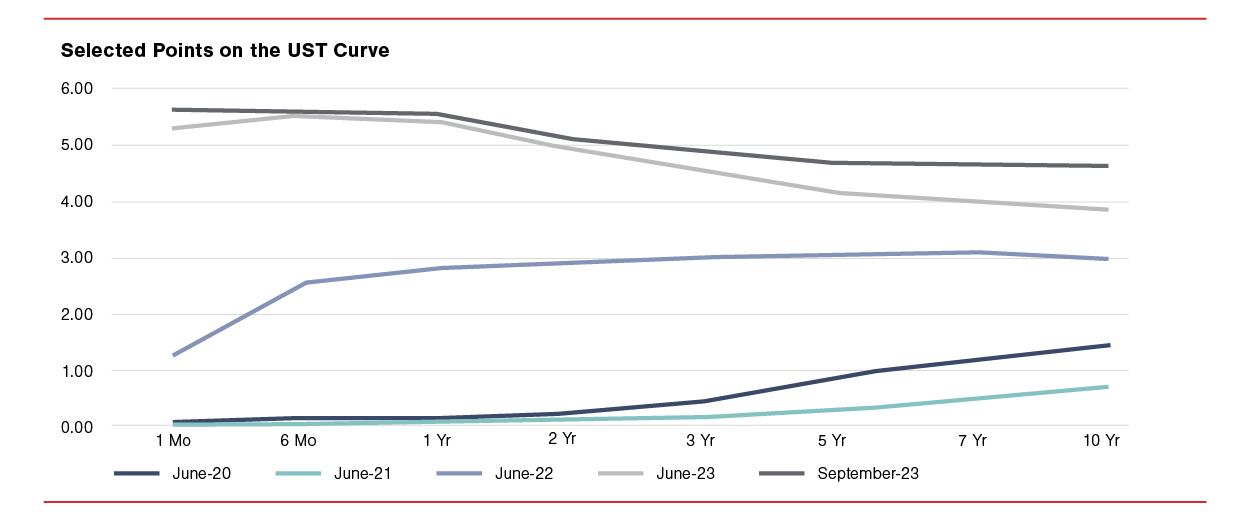
| UST Curve | 1 Mo | 6 Mo | 1 Yr | 2 Yr | 3 Yr | 5 Yr | 7 Yr | 10 Yr |
|---|---|---|---|---|---|---|---|---|
| June-20 | 0.13 | 0.18 | 0.16 | 0.16 | 0.18 | 0.29 | 0.49 | 0.66 |
| June-21 | 0.05 | 0.06 | 0.07 | 0.25 | 0.46 | 0.87 | 1.21 | 1.45 |
| June-22 | 1.28 | 2.51 | 2.80 | 2.92 | 2.99 | 3.01 | 3.04 | 2.98 |
| June-23 | 5.24 | 5.47 | 5.40 | 4.87 | 4.49 | 4.13 | 3.97 | 3.81 |
| September-23 | 5.55 | 5.53 | 5.46 | 5.03 | 4.80 | 4.60 | 4.61 | 4.59 |
While the U.S. economy was dealing with the fallout caused by the COVID-19 pandemic, the U.S. government, the Federal Reserve, and the U.S. Department of the Treasury were busy providing fiscal stimulus and relief packages. In addition to the CARES Act and the American Rescue Plan, monetary policy actions like quantitative easing and holding interest rates near zero, the Paycheck Protection Program, student loan forbearance, and stimulus checks to individuals flooded the markets with liquidity. Deposit balances at banks surged.
As the pandemic eased and consumers returned to work and resumed normal purchasing patterns, supply-chain bottlenecks and the stimulus-induced liquidity caused inflation to rise to levels not seen since 1981. These inflationary concerns caused long-term rates to rise. Between June 2020 and June 2022, the five-year treasury, a benchmark for commercial loans, rose by 272 basis points while short-term rates rose by only 125 basis points. In response to the rapid onset of inflation, the Fed began raising its target rate. The federal funds rate has now been raised 11 times in 17 months for a total of 525 basis points. Initially, the UST curve maintained its positive slope, but eventually, the long end of the curve couldn’t keep pace, resulting in the inverted curve we have today.
The following graphic illustrates how the UST curve has changed. It should be noted that the short end of the UST curve historically tracks the federal funds rate very closely while the long end of the curve does not.
Graph shows changes in the U.S. Treasury curve in the last three years. Federal Reserve. federalreserve.gov.
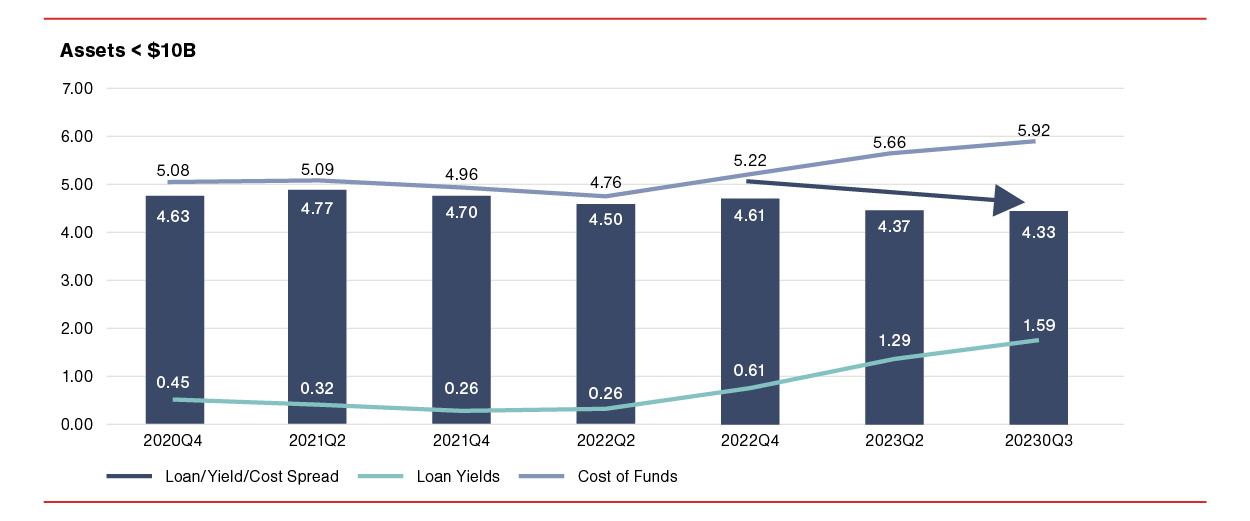
Let’s now look at how bank performance has changed due to this rapid increase in rates. The table below is the median data gathered from all commercial and savings banks with total assets below $10 billion.
| Assets < $10B | 2020Q4 | 2021Q2 | 2021Q4 | 2022Q2 | 2022Q4 | 2023Q2 | 2023Q3 |
|---|---|---|---|---|---|---|---|
| Loan Growth Rate | -7.87 | 1.24 | 4.72 | 15.33 | 12.11 | 10.12 | 7.53 |
| Loan/Asset | 63.15 | 59.69 | 57.70 | 59.41 | 63.09 | 65.25 | 65.97 |
| Deposit Growth Rate | 13.79 | 5.73 | 10.21 | 1.08 | -1.45 | -3.21 | 1.51 |
| Loans/Deposits | 73.94 | 69.67 | 67.08 | 67.84 | 72.93 | 76.52 | 77.95 |
| ROA | 0.98 | 1.15 | 0.91 | 1.02 | 1.12 | 1.03 | 0.99 |
| ROE | 8.96 | 10.95 | 8.74 | 11.42 | 13.25 | 11.50 | 11.38 |
| Equity/Assets | 10.67 | 10.35 | 10.18 | 8.85 | 8.82 | 9.11 | 8.99 |
| NPLs/Loans | 0.65 | 0.54 | 0.45 | 0.37 | 0.32 | 0.29 | 0.30 |
| LLR/Loans | 1.30 | 1.31 | 1.32 | 1.29 | 1.24 | 1.25 | 1.24 |
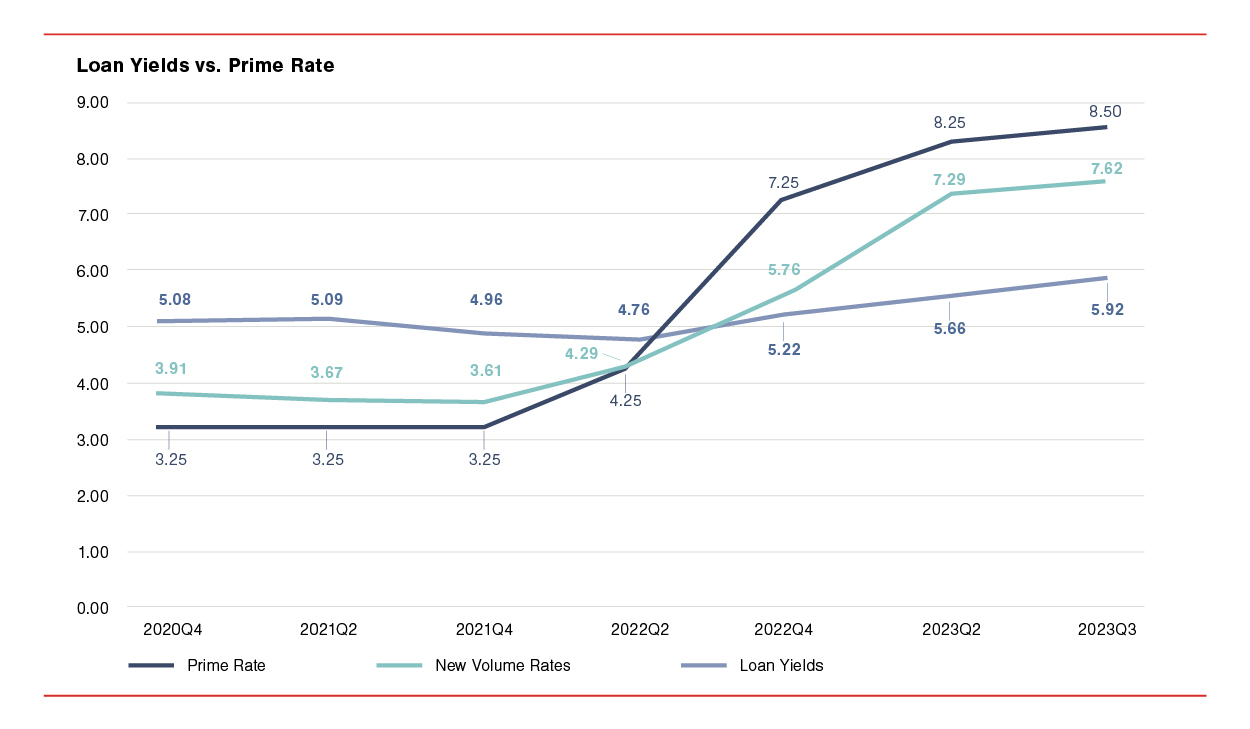
| Prime Rate | 3.25 | 3.25 | 3.25 | 4.25 | 7.25 | 8.25 | 8.50 |
| New Volume Rates | 3.91 | 3.67 | 3.61 | 4.29 | 5.76 | 7.29 | 7.76 |
| Loan Yields | 5.08 | 5.09 | 4.96 | 4.76 | 5.22 | 5.66 | 5.92 |
| Cost of Funds | 0.45 | 0.32 | 0.26 | 0.26 | 0.61 | 1.29 | 1.59 |
| Loan Yield/Cost Spread | 4.63 | 4.77 | 4.70 | 4.50 | 4.61 | 4.37 | 4.33 |
From the end of 2020 to the middle of 2022, both loan yields and deposit cost of funds decreased. On the loan side, contractual runoff was being replaced with new loans at lower rates. Weak demand and competitive pressure for commercial loans kept the rate on new loans below 4.00%. Non-interest bearing and other low-cost deposit balances continued to increase, resulting in the cost of liabilities bottoming out in the middle of 2022.
Beginning in the third quarter of 2022, banks began quoting (and receiving) higher rates on commercial loans. The long end of the UST curve, i.e., the Ten Year, also increased, causing higher rates on new residential mortgages. For a short time, net interest margins increased as banks deferred increasing their deposit rates. As you can see in the graph below, by the middle of 2023, deposit cost increases outpaced the increase in loan yields, resulting in decreased margins. This trend is predicted to continue as loan yields are rising at a slower pace and deposit costs continue to increase.
Loan yields versus the costs of funds. S&P Global Market Intelligence – New Volume Rates from LoanPricingPRO.
While there are many reasons for this increased margin pressure, one of the main contributors is the way commercial loans are being priced. Below is an illustration of how current loan yields and, more importantly, new loan rates compared to the prime rate.
Until the end of 2021, bankers remained disciplined in attaining a spread over prime on new commercial loans. Even with rates at historical lows and facing fierce competition, the yield spread was 40-60 bps over prime.
Since mid-2022, there has been a dramatic shift. Rates offered on new loans, while still increasing, have dropped to a negative spread to prime. This trend worsened by the third quarter of 2023 to nearly 100 basis points below prime.
Loan yields relative to the prime rate. S&P Global Market Intelligence – New Volume Rates from LoanPricingPRO.
There are likely many reasons for this trend. Competition has remained fierce with too much liquidity chasing too few loans. Also, alternative investment options now have yields well below the rates on new loans. To many lenders, a 7.50% loan rate looks great compared to the 4.00% new loan rate from 18 months ago. Finally, some believe rates have peaked and will start to decline soon. All of these are common reasons to consider locking in loans at rates below prime.
But, let’s not forget about the increased cost of funding these loans.
Banks that have a disciplined pricing model can easily calculate the profitability impact of today’s environment. This should include a profitability analysis of the full customer relationship and not just loan profits. Decisions to offer commercial loans at rates less than prime should be based on sound pricing analytics.
LoanPricingPRO® Scenarios
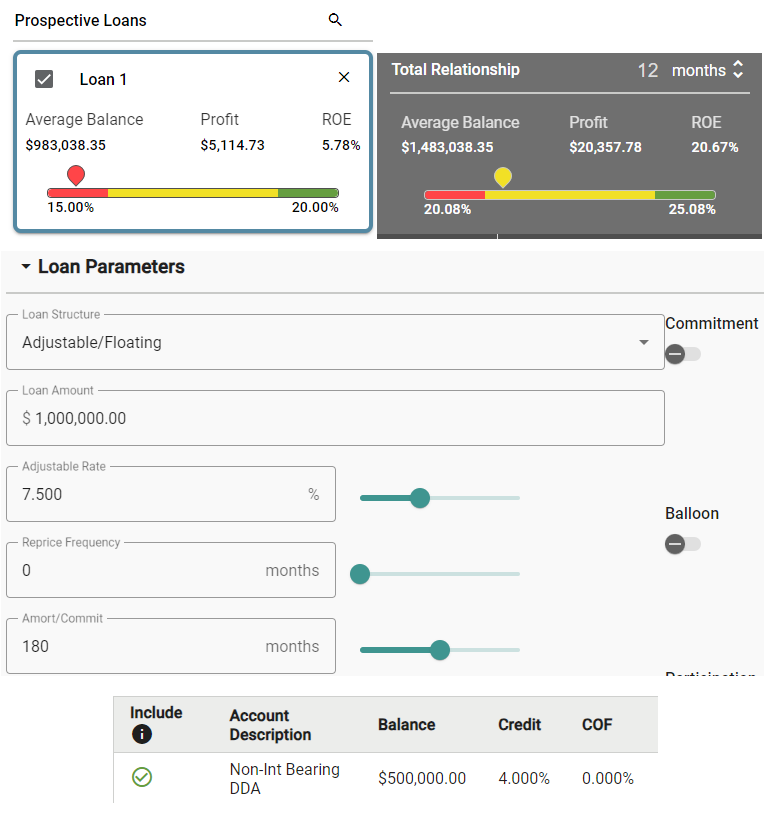
Two years ago, the average commercial customer typically had loans with rates 40–60 bps over prime as well as significant non-interest-bearing deposit balances. The value given to these deposits through a funds transfer pricing process allowed for very competitive pricing on the loan. The example below shows a floating rate loan priced at prime with profitability slightly below the target. But, after adding the compensating non-interest-bearing deposit, the full customer relationship return on equity exceeds the bank’s minimum target levels.
June 2021 – Floating rate loan at prime and large non-interest bearing deposit.
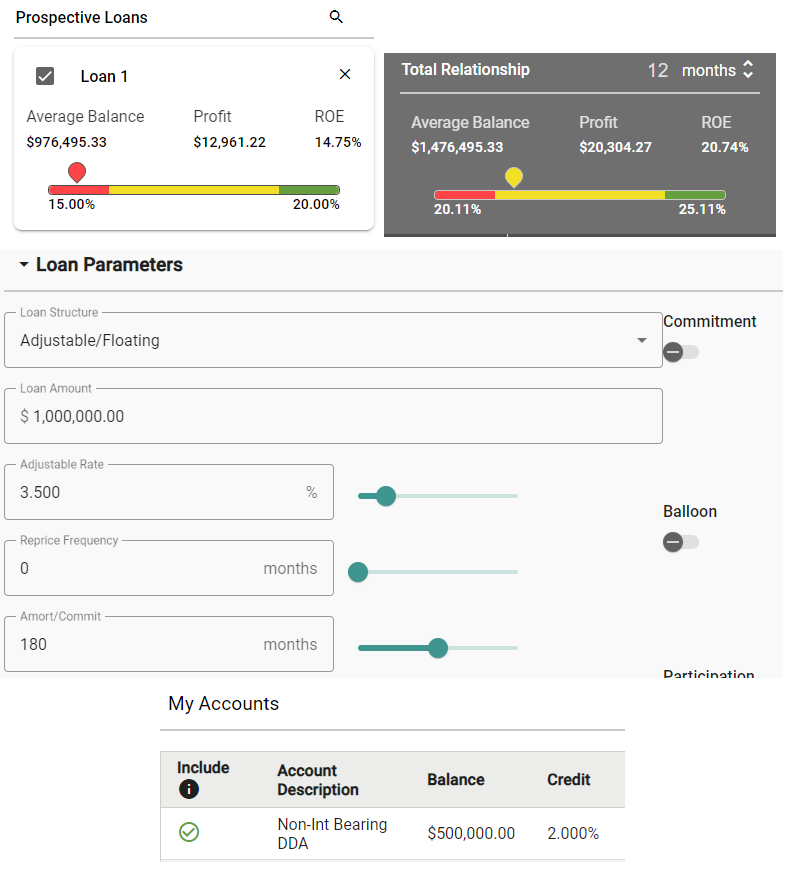
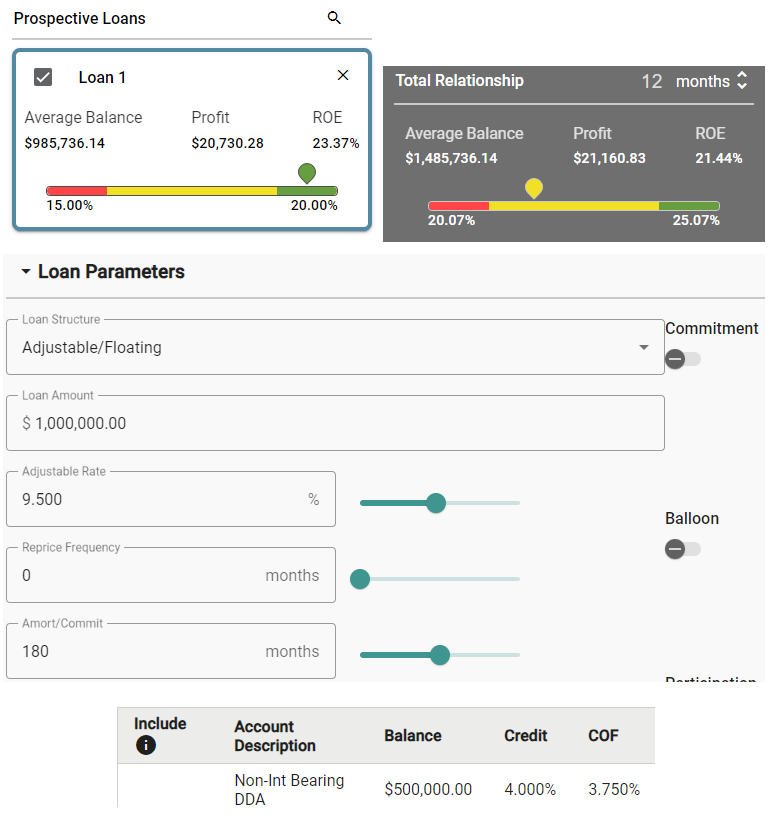
Fast forward to today. If this loan has been renewed or replaced at a “prime minus” rate, the relationship may still be profitable if the cost of those same deposits hasn’t increased by more than the change in market rates. But, if the rate paid on those deposits has increased substantially or if they have moved to a high-yield CD or money market account, then the value of these deposits has fallen, and they are no longer providing support for a lower loan rate. In this case, the loan rate needs to have a much higher “prime plus” rate to compensate for the higher deposit cost.
Current environment – Floating rate loan at prime minus 100 bps and large NIB DDA.
Current environment - Floating rate loan at prime plus 100 bps with high-cost deposit.
Conclusion
There is no one-size-fits-all approach to setting rates on commercial loans in today’s challenging environment. However, the bank can maintain profitability through any interest rate environment by adhering to a disciplined approach to making pricing decisions based on a complete understanding of relationship profitability. Visit the LoanPricingPRO® page to learn more about the FORVIS strategic loan pricing solution.